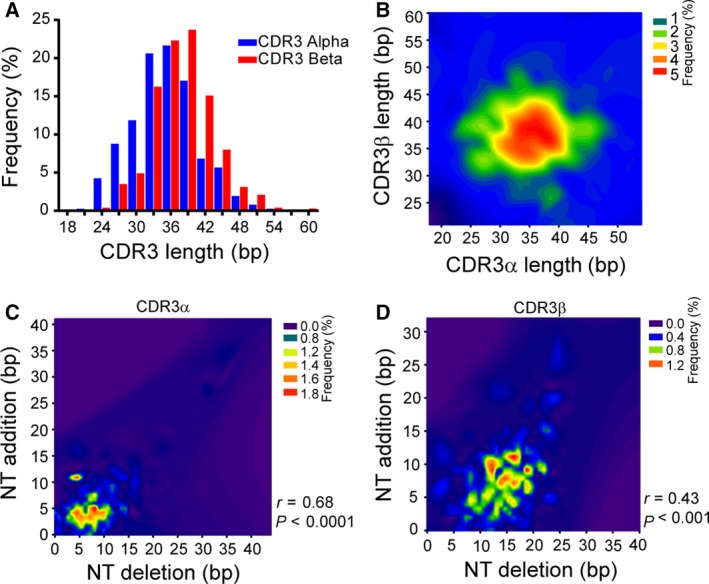
Figure 2.

The CDR3 length distribution in paired samples. (A) The distribution of CDR3 length (bp) in both alpha (blue bar) and beta (red bar) chains. (B) The distribution of CDR3 lengths among the unique paired samples. The color indicates the frequency of each length. The correlation between nucleotide deletions and insertions in both alpha (C) and beta (D) chains. The color indicates the frequency, and the correlations were tested with the Spearman rank test.
