
Figure 3.
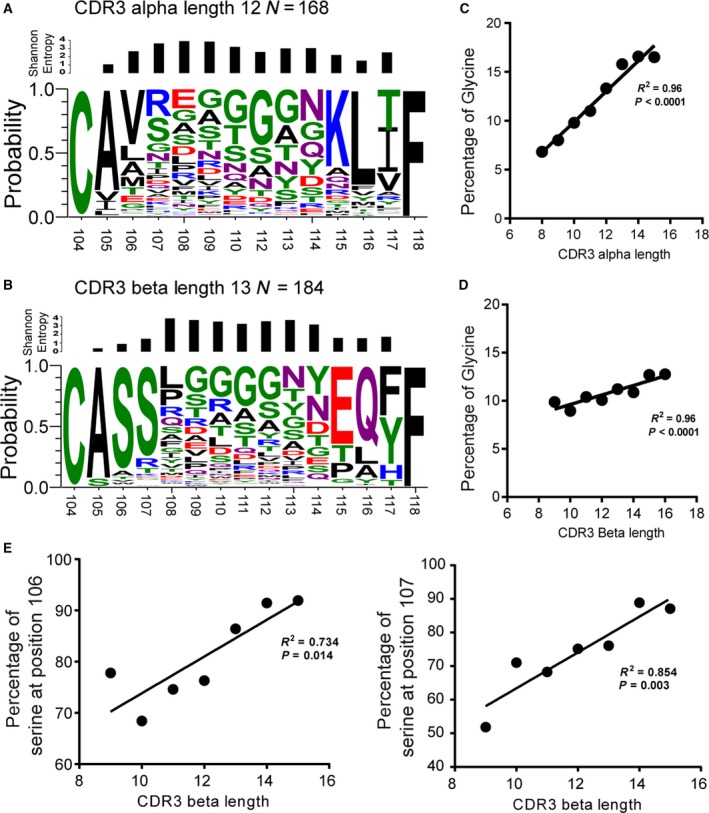
Amino acid residue distribution in paired CDR3 regions. The representative data for amino acid composition were displayed with weblogo 3.4 software for both the alpha (A) and beta (B) chains. The size of the letters represents the frequency of the amino acid at each position. (C) and (D) show the frequency of Glycine usage and the correlation with CDR3 length for both alpha and beta CDR3, respectively. (E) shows the frequency of serine usage in the CDR3 base.