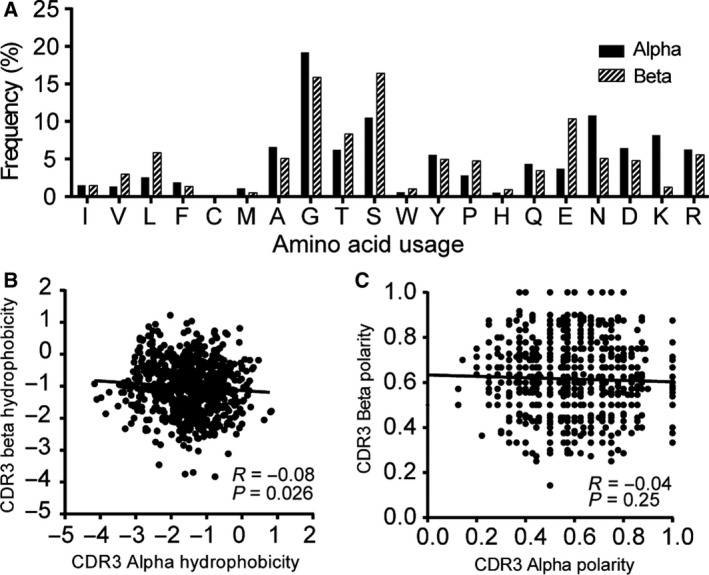
Figure 4.

Paired CDR3α and CDR3β sequences in human CD8 T cells. The frequency of amino acid usage was calculated for positions 107–115 for alpha (black bar) and beta (white bar) chains, and the χ2 test was used to calculate the significance. (B) and (C) show a comparison of hydrophobicity and polarity in both alpha (white) and beta (blocked) chains. Hydrophobicity (B) and polarity (C) are defined in the text, and each symbol represents one CDR3αβ pair (N = 776). The correlation was assessed by using Spearman's rank correlation coefficient.
