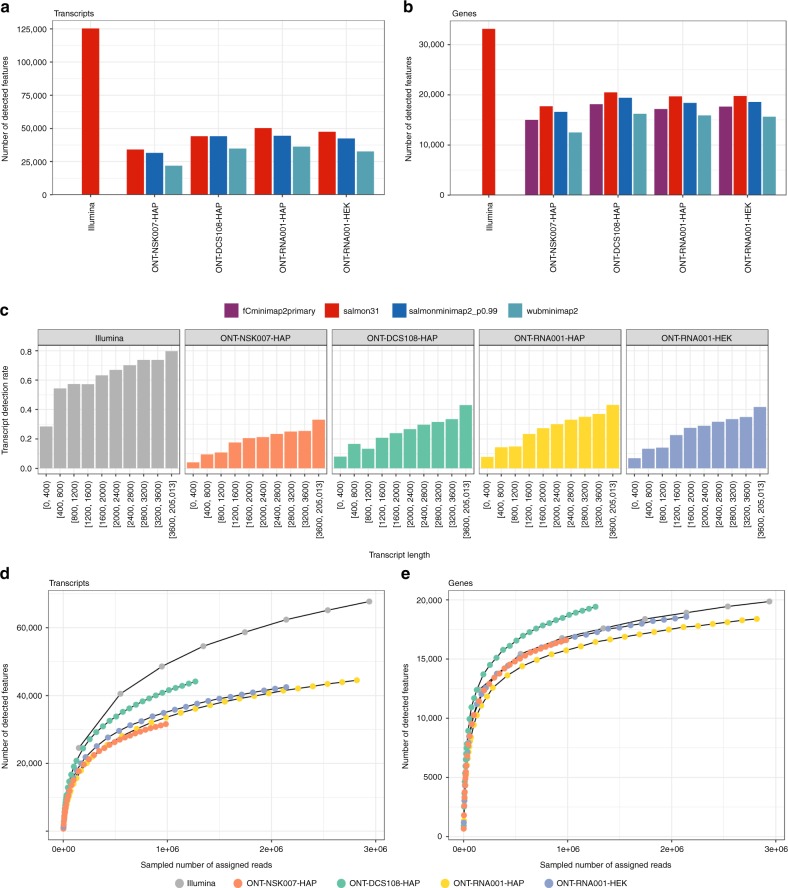
Fig. 4.
Detection of annotated transcripts and genes. a, b Number of detected transcripts and genes with the applied abundance estimation methods. Here, a feature is considered detected if the estimated read count is ≥1. c Fraction of transcripts detected (with estimated count ≥ 1), stratified by transcript length, in the respective data sets. d, e Saturation of transcript and gene detection in ONT and Illumina data sets. For each data set, we aggregated reads across all replicates, subsampled the reads and recorded the number of transcripts and genes detected with an estimated salmonminimap2 count (ONT libraries) or Salmon count (Illumina libraries) ≥1. The Illumina curves are truncated to the range of read numbers observed in the ONT data sets. Source data are provided as a Source Data file

