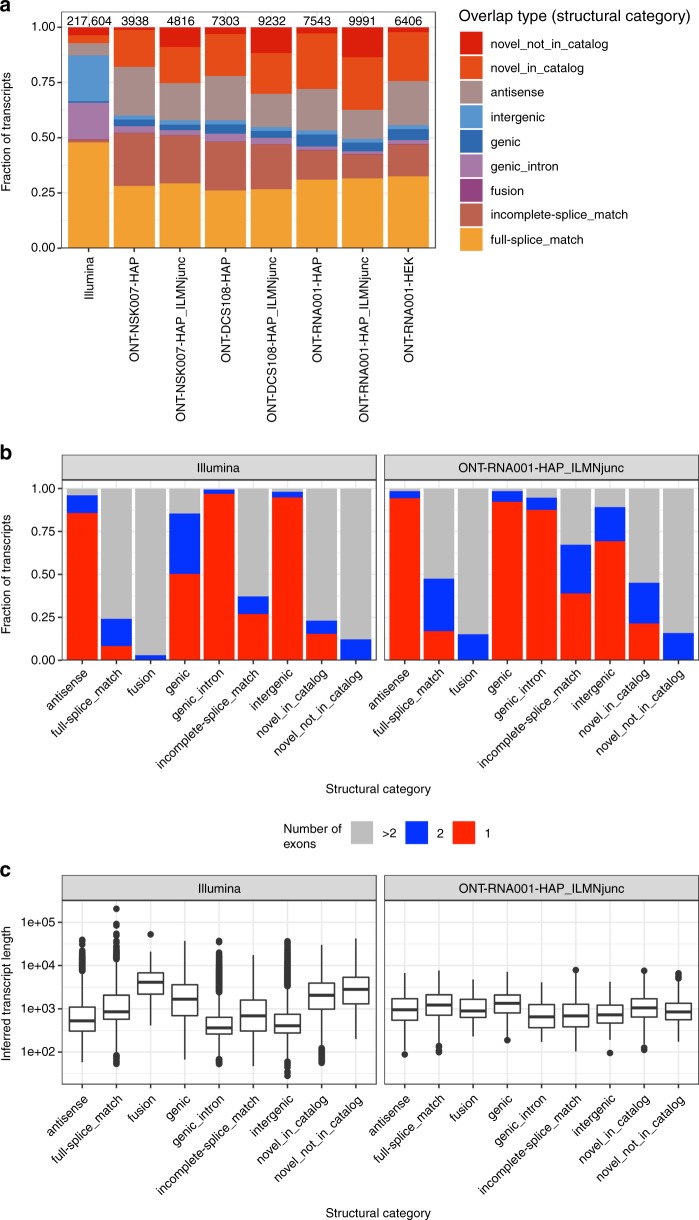
Fig. 6.
Characterization of transcripts identified by FLAIR. a Structural category distribution for de novo identified transcripts from FLAIR (for ONT libraries) or StringTie (for Illumina libraries), compared with the set of annotated transcripts using SQANTI. The number above each bar represents the number of assembled transcripts. The structural category for a transcript indicates its relation to the closest annotated transcript. The _ILMNjunc suffix indicates that junctions identified in the Illumina libraries were supplied when running FLAIR. b Number of exons in each transcript identified by FLAIR/StringTie, stratified by the relation to the annotated transcripts (represented by the assigned structural category). c Length distribution of transcripts identified by FLAIR/StringTie, stratified by the relation to the annotated transcripts (represented by the assigned structural category). The center line represents the median; hinges represent first and third quartiles; whiskers the most extreme values within 1.5 interquartile range from the box. Source data for panels a, b are provided as a Source Data file

