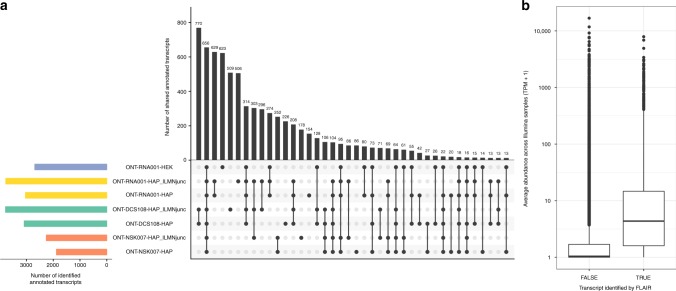
Fig. 7.
Comparison of annotated transcripts identified by FLAIR in the four ONT data sets. a UpSet plot representing overlaps between the annotated transcripts that are identified by FLAIR in the different ONT data sets. An annotated transcript is considered to be identified if at least one FLAIR transcript is assigned to it with a structural category annotation of either ‘full-splice_match’ or ‘incomplete-splice_match’. These sets of annotated transcripts are then compared between data sets. Horizontal bars indicate the total number of identified annotated transcripts in the respective data sets, and vertical bars represent the size of each intersection of one or more sets of identified transcripts. b Average abundance across the Illumina samples, for annotated transcripts that are considered identified or not by FLAIR. An annotated transcript is considered to be identified if at least one FLAIR transcript from at least one data set is assigned to it with a structural category annotation of either ‘full-splice_match’ or ‘incomplete-splice_match’. The center line represents the median; hinges represent first and third quartiles; whiskers the most extreme values within 1.5 interquartile range from the box

