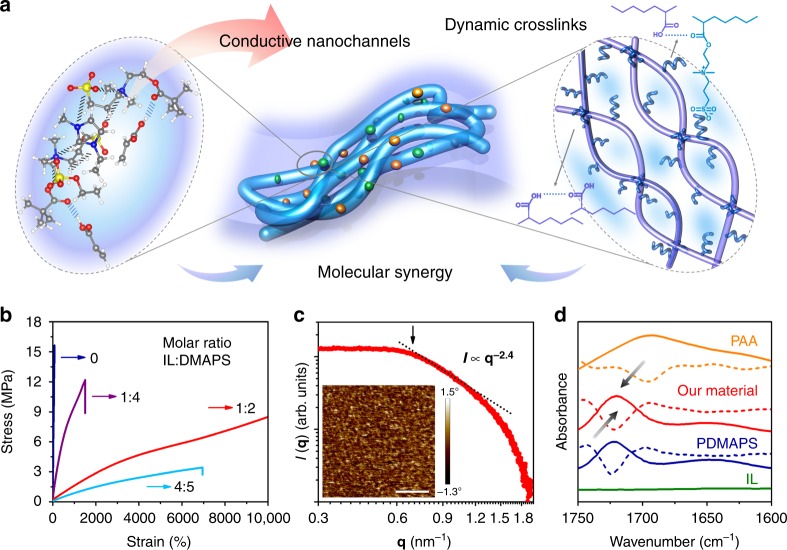
Fig. 1.
Molecular synergistic design. a Schematic illustration of the molecular synergistic design, including the optimized ion-rich structure predicted by DFT and the dynamic hydrogen-bond networks. b The true tensile stress–strain curves of the conductors with different contents of the IL. The strain rate is 0.17 s−1. c The SAXS profile of the intrinsically stretchable conductor. The inset picture is the AFM phase image of the conductor. (scale bar: 100 nm) d IR spectra and corresponding second derivative curves of the intrinsically stretchable conductor, PAA, PDMAPS, and IL in the region of 1750–1600 cm−1

