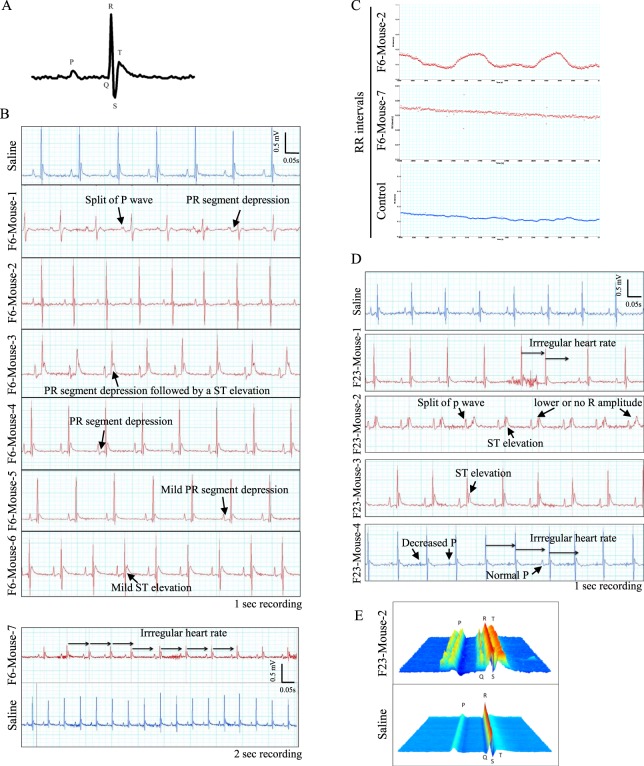
Figure 4.
Functional abnormality in electrocardiogram (EKG) in an oral infection mouse model. The 3-day-old NOD/SCID mice were infected orally with 107 pfu of EV71-F6 (n = 7), EV71-F23 (n = 4) or normal saline. Infected mice were examined by EKG analysis on day 16 post-infection. (A) A representative configuration of a typical mouse electrocardiogram is derived from an average of four consecutive heartbeats of an uninfected littermate. P wave: the electrical manifestation of spread of atrial excitation; QRS complex: the electrical manifestation of spread of ventricular excitation; T wave: repolarization of the ventricles. (B) EKG in one-second recording showed a consistent split of P wave in F6-Mouse-1, PR segment depression in F6-Mouse-1, -3, -4 and -5, and ST elevation in F6-Mouse-3, and mild ST elevation in F6-Mouse-6. In two-second recording, irregular heart rate was evident in F6-mouse-7. (C) RR intervals showed irregular heart rate in F6-Mouse-2 and -7. (D) EKG showed irregular heart rate in mouse F23-Mouse-1 and -4, shortened or no R amplitude in mouse F23-Mouse-2, apparent ST elevation in F23-Mouse-2 and -3, and nearly abolished P wave in mouse F23-Mouse-4. (E) A Waterflow Plot resolved split P peaks and R amplitude in F23-mouse-2.

