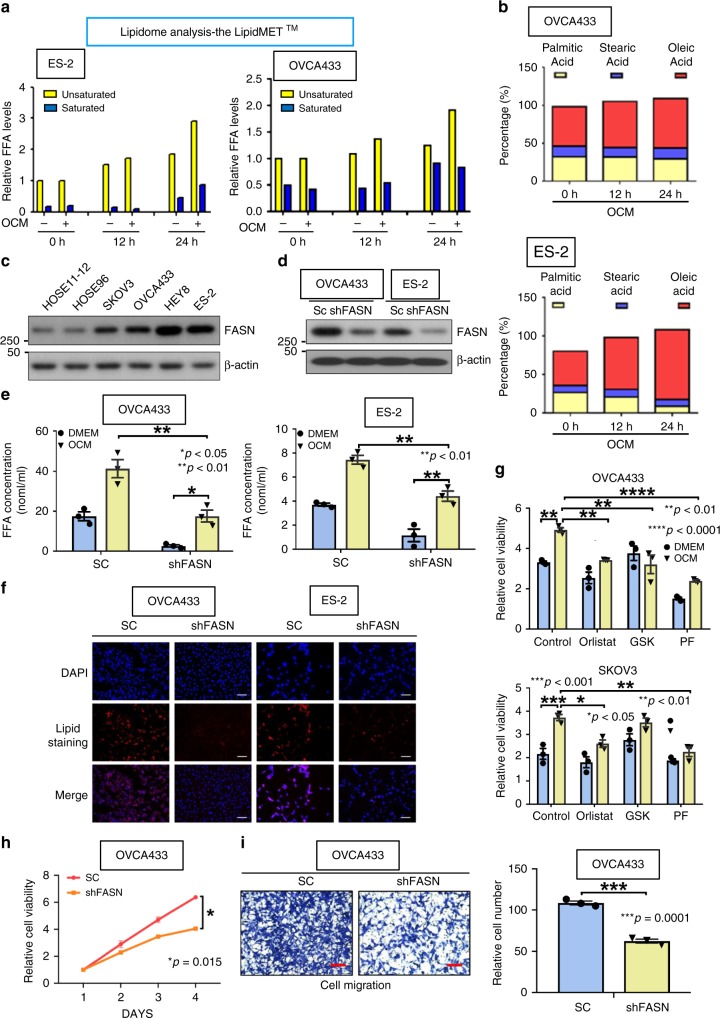
Fig. 4.
Ovarian cancer cells undergo lipogenesis in OCM. a The bar chart shows the Lipidomic analysis of the amount of intercellular unsaturated and saturated fatty acids in two ovarian cancer cells which were cultured in OCM from 0 to 24 h. The DMEM is used as a negative control. The Lipidomic analysis was performed by Metabo-Profile, Shanghai, China. b The percentage bar chart shows the changes of the major unsaturated fatty acid, Oleic acid, and two saturated fatty acids, Stearic acid and Palmitic acids in OVCA433 and ES-2 cells cultured in OCM from 0 to 24 h. c Western blot analysis compares the expression level of a key lipogenic enzyme, FASN, in two HOSEs and four ovarian cancer cell lines, SKOV3, OVCA433, Hey8, and ES-2. d Western blot analysis shows the reduction of FASN knockdown by lentiviral shRNAi approach in OVCA433 and ES-2. e Free fatty acid assay demonstrates the depletion of FASN leads to the reduction of long chain fatty acid (>8 carbon) in OVCA433 and ES-2 cells when cultured in DMEM or OCM. f Lipid droplet formation assay reveals the formation of lipid droplets in FASN knockdown OVCA433 and ES-2 cells as compared with their scrambled controls (SC). Scale bar = 50 µm. g XTT cell proliferation assay shows that 3 days of co-treatment with the above FASN inhibitors, orlistat (30 µM) and GSK2194069 (100 nM) (GSK), or AMPK activator, PF-06409577 (50 μM) (PF), significantly reduces the OCM-induced cell growth rate in SKOV3 and OVCA433 cells. h XTT cell proliferation assay reveals that the cell proliferation of OVCA433 with or without FASN knockdown co-cultured in OCM for 4 days. i Transwell cell migration assay shows the cell migratory rate of OVCA433 with or without FASN knockdown co-cultured in OCM for 12 h. The stained cells were counted from three selected fields randomly. Representative images and quantitative results of cell migration were shown. Scale bar = 50 µm. Results were presented as mean ± S.E.M. Data were analyzed by Student’s t-tests or one-way/two-way ANOVA with Tukey’s post hoc test (*p < 0.05, **p < 0.01, ***p < 0.001, ****p < 0.0001)

