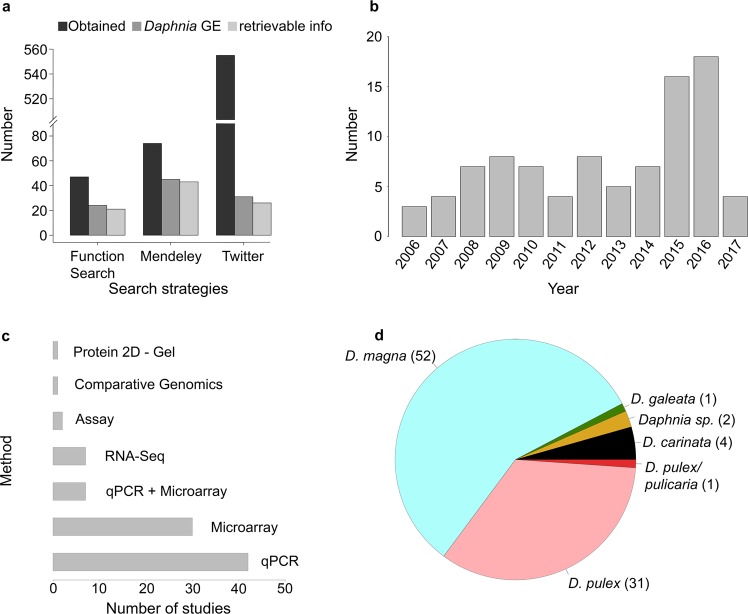
Figure 1.
Literature statistics for the present study. (a) Barplot indicating the number of studies obtained for each search strategy used in this study. Bars in black represent all literature obtained in each search strategy. Bars in dark grey represent the number of studies specific to Daphnia and gene expression; bars in light grey represent the number of studies from which data was retrievable for analysis. (b) Timeline for studies on gene expression in Daphnia. (c) Barplot showing the number of studies available for different analysis method used in the literature. (d) Pie chart showing the number of studies available for each Daphnia species.

