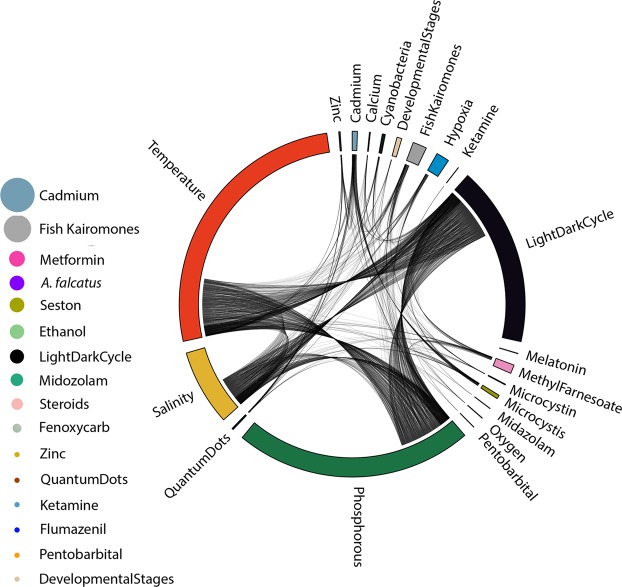
Figure 4.
Circular and bubble plot showing the number of genes associated to one or more stressors in D. pulex. Every stressor field on the circular plot represents the list of genes identified to be differentially expressed, and its size is proportional to the number of genes. A line linking this field to another one means that a gene is differently expressed for this stressor as well. For genes that followed other gene ID nomenclature for D. pulex, stressors are represented through bubbles on the left side of the circular plot, and the bubble size is proportional to the number of genes.

