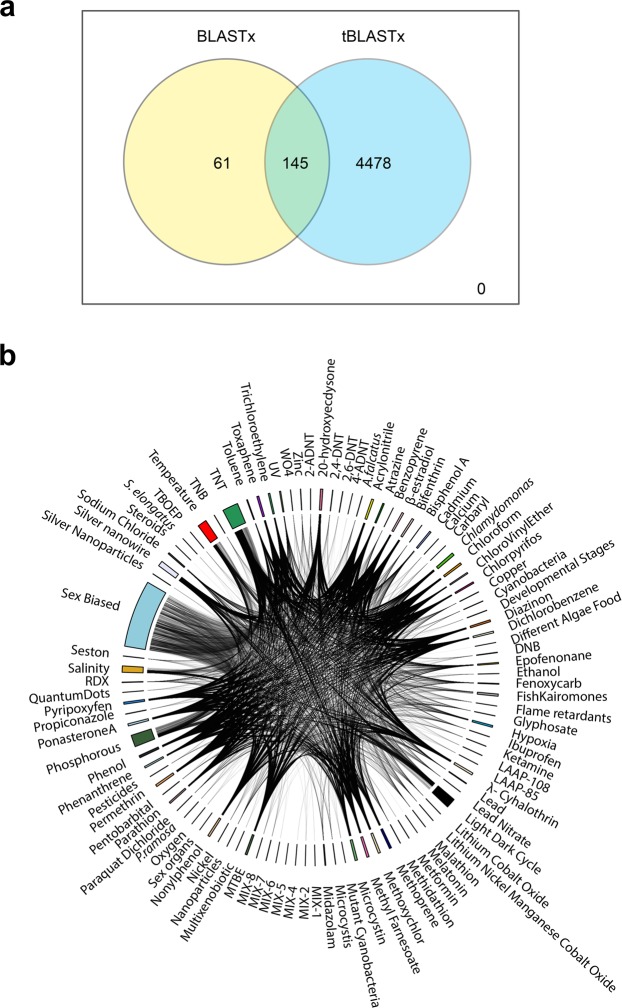
Figure 5.
(a) Venn diagram representing the overlap between blastx and tblastx analysis used for annotating D. galeata transcripts. (b) Circular plot showing the D. galeata transcripts presenting sequence homology to at least one sequence in the Daphnia stressor db, classified according to the stressor affecting their expression Every stressor field represents the list of genes identified to be differentially expressed. A line linking this field to another one means that a gene is differently expressed for this stressor as well.

