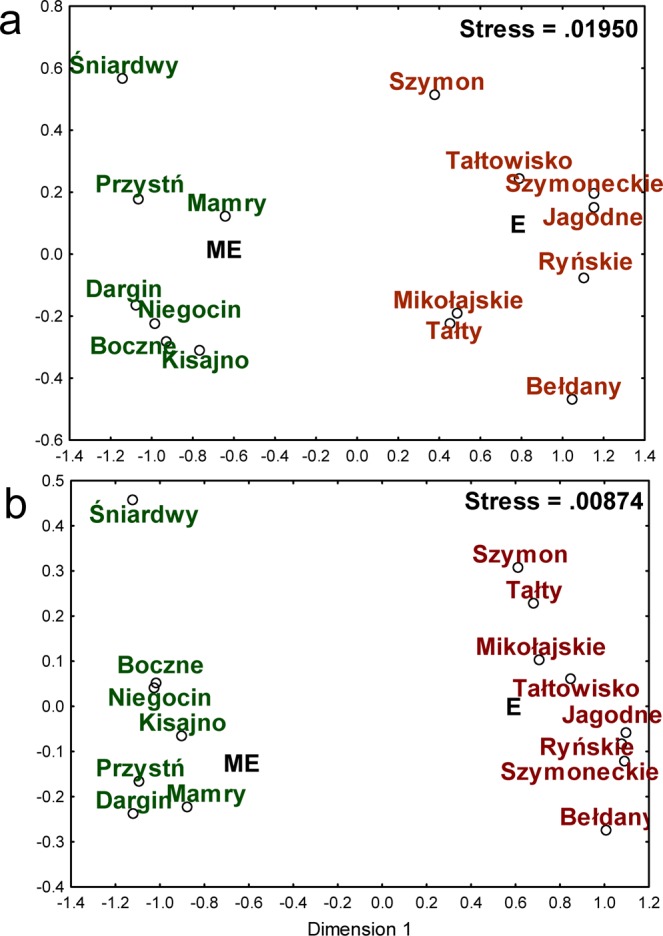
Figure 3.

(a) The graphical results of the Bray-Curtis-based NMDS analysis of sequence data, binned by taxonomic assignment to family. The whole domain Bacteria was taken into consideration. The lakes marked in red are eutrophic (E), and lakes marked in green are meso-eutrophic (ME). (b) The graphical results of the Bray-Curtis-based NMDS analysis of sequence data, binned by taxonomic assignment to family, after excluding 25 families belonging to phylum Cyanobacteria from the analysis. The lakes marked in red are eutrophic (E), and lakes marked in green are meso-eutrophic (ME).
