Figure 5.

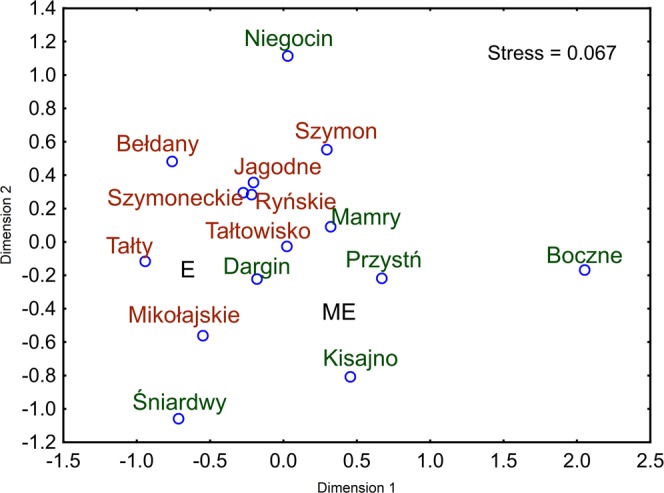
Bray-Curtis-based NMDS analysis of the relative respiration of 31 different carbon sources by bacteria in the studied lakes. The lakes marked in red are eutrophic (E), and lakes marked in green are meso-eutrophic (ME).

Bray-Curtis-based NMDS analysis of the relative respiration of 31 different carbon sources by bacteria in the studied lakes. The lakes marked in red are eutrophic (E), and lakes marked in green are meso-eutrophic (ME).