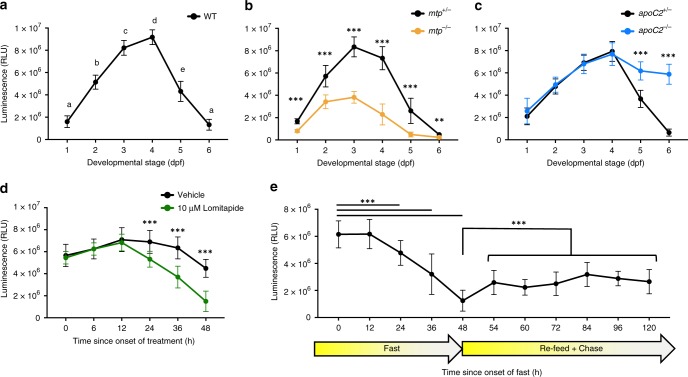
Fig. 2.
LipoGlo counting reveals conserved apolipoprotein B-containing lipoprotein (ApoB-LP) responses to genetic, dietary, and pharmacological stimuli. a LipoGlo signal throughout wild-type (WT) larval zebrafish development (1–6 pf). Time points designated with different letters are statistically significantly different by Tukey’s honestly significant difference (HSD) with p < 0.0001 (degrees of freedom (DF) = 5, n = 24, analysis of variance (ANOVA) p < 0.0001, Tukey’s HSD p < 0.0001). b Comparison of LipoGlo signal between mtp−/− mutants (defective in lipoprotein synthesis) and mtp+/− siblings during larval development (DF = 11, n ≈ 16, two-way robust ANOVA p < 0.0001 for genotype and stage, Games–Howell p < 0.001). c Comparison of LipoGlo signal between apoC2−/− mutants (defective in lipoprotein breakdown) and apoC2+/− siblings during larval development (DF = 11, n ≈ 12, two-way robust ANOVA p < 0.0001 for genotype and stage, Games–Howell p < .0001). d Effect of lomitapide (10 μM, microsomal triglyceride transfer protein (Mtp) inhibitor) on LipoGlo signal (3–5 days post fertilization (dpf)) (DF = 11, n = 30, two-way robust ANOVA p < 0.0001 for treatment and time, Games–Howell p < 0.0001). e LipoGlo levels were measured over time throughout a fast, re-feed, and chase period. Larvae were fed a standard diet ad libitum from 5 to 10 dpf, and then were deprived of food for 48 h (fast period). Larvae were then fed a high-fat (5% egg yolk) diet for 6 h, and this meal was chased for 72 h starting at the onset of feeding (48–120 h) (DF = 10, n = 30, Welch’s ANOVA p < 0.0001, Games–Howell p < 0.0001). ** denotes p < 0.001, and *** denotes p < 0.0001. Error bars represent standard deviation. Results represent pooled data from three independent experiments, “n” denotes number of samples per data point, mean ± SD shown. Source data are provided as a Source Data file

