Fig. 1.
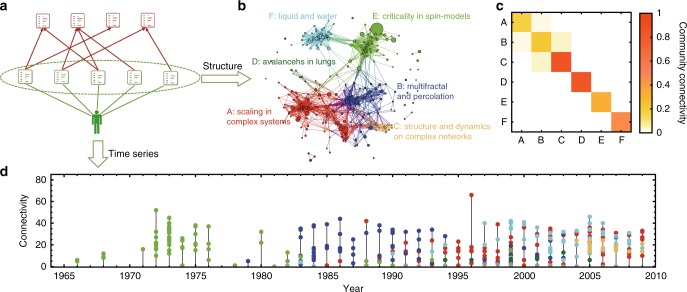
Illustration of the co-citing network (CCN) of a typical highly cited scientist and its growth history. a The data and method used to construct the co-citing network. The papers authored by the scientist are marked in green, and the references of these papers are marked in red. b The co-citing network consists of all the papers published by this scientist. Each paper is represented by a node, and two papers are connected if they share at least one reference. The communities of this network are identified with the fast unfolding algorithm, which detects communities by maximizing the modularity function. The network contains several large-size communities, as well as some small clusters and isolated nodes. Each major community represents a main research topic of this scientist. c The community connectivity matrix shows that nodes within each community are well connected, yet nodes of different communities are much less connected. Here, the connectivity between two communities is computed as the real number of links between them over the possible maximum number of links between them. d The time series presented at the bottom describes the growth history of the network and meanwhile reveals how this scientist moves from one research topic to another during her career. In the sub-figure of time series, each point is a paper, and the color corresponds to the community in the co-citing network. The height of the point is the number of links (i.e., connectivity) that the paper has in the network

