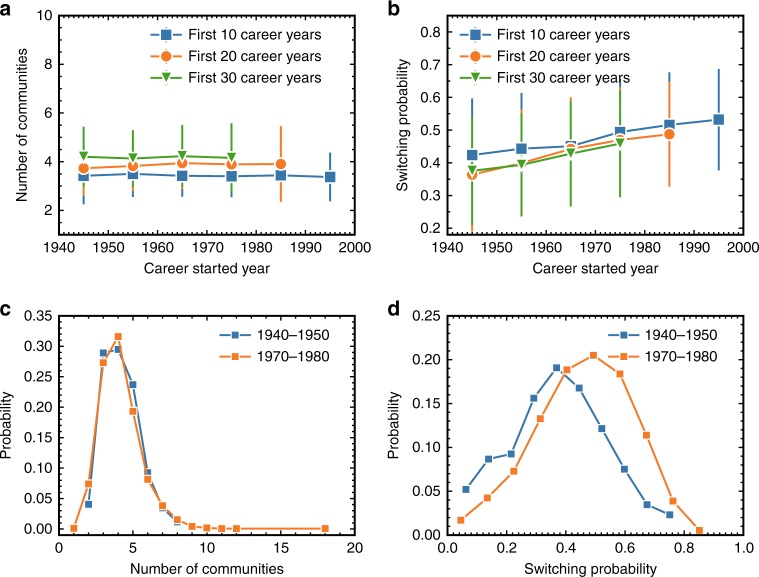
Fig. 4.
Evolving trend of number of communities and switching probability as the development of science. a The mean number of communities of scientists who started their career in different years. b The average switching probability of scientists who started their career in different years. The error bars here represent standard deviations. As our data ends in 2010, it cannot capture the full career of scientists who started their careers in recent years. We thus filter out some scientists when we study the evolution of science here. We only consider scientists’ first y career years and remove (i) all the scientists that did not reach yet y years of career (for a fair temporal comparison), and (ii) those who published less than 30 papers in their first y career years (for a meaningful community detection). The results of y = 10,20,30 are presented in this figure. As science evolves (during the years), the number of major communities that each scientist has stays almost unchanged, while the frequency that scientists switch between communities increases during the years. c Distributions of the number of communities (for y = 30) for scientists who started their career between 1940 and 1950, and for those who started their career between 1970 and 1980. The p-value of the Kolmogorov–Smirnov test is 0.961, suggesting a significant similarity between these two distributions. d Distributions of the switching probability (for y = 30) of scientists who started their career between 1940 and 1950, and of those who started their career between 1970 and 1980. The p-value of the Kolmogorov–Smirnov test is 2.34 × 10⁻⁸, suggesting a significant difference between these two distributions (i.e., increase of switching probability)

