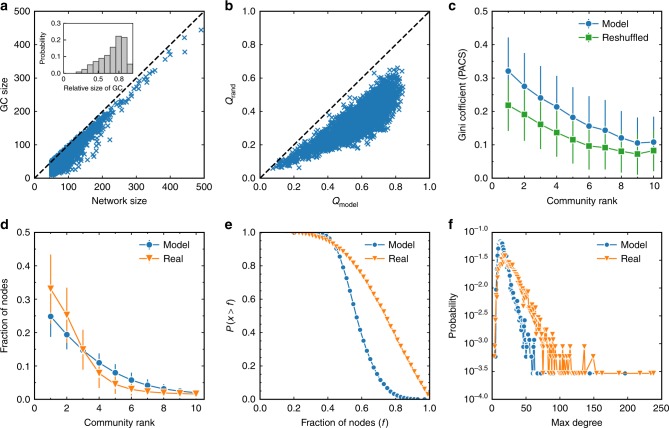
Fig. 6.
Structural properties of the generated scientists’ CCNs based on the EEM. a The size of the modeled co-citing network (CCN) versus the size of CCN’s giant component (GC). Each point represents a modeled scientist. b The maximized modularity in the modeled CCNs (Qmodel) and the maximized modularity in their degree-preserved reshuffled counterparts (Qrand). c The Gini coefficient of the distribution of PACS codes in different communities. Communities are ranked by size in a descending order. The model data are compared with a random counterpart, where the PACS codes are reshuffled. d The fraction of papers in different communities of real data and model data. e The inverse cumulative probability of fraction of nodes in the three largest communities for real data and model data. f The distribution of the maximum degree in scientists’ real CCNs and modeled CCNs. In this figure, the parameters of EEM are chosen as p = 0.6 and q = 0.2, and the error bars represent standard deviations

