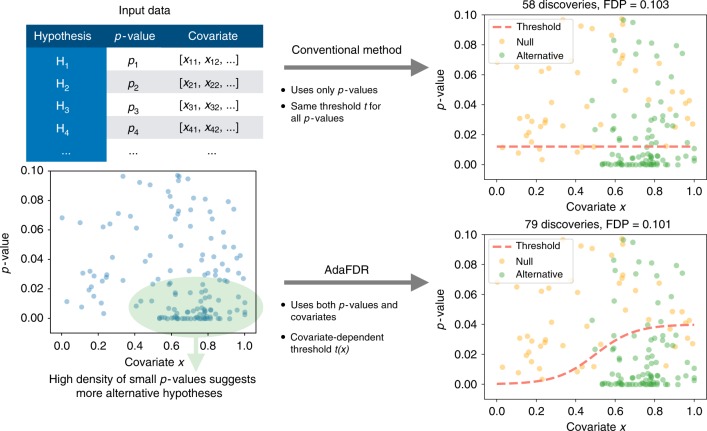
Fig. 1.
Intuition of AdaFDR. Top-left: As input, AdaFDR takes a list of hypotheses, each with a p-value and a covariate that could be multi-dimensional. Bottom-left: A toy example with a univariate covariate. The enrichment of small p-values in the bottom-right corner suggests that there are more alternative hypotheses there. Leveraging this structure can lead to more discoveries. Top-right: Conventional methods use only p-values and have the same p-value threshold for all hypotheses. Bottom-right: AdaFDR adaptively learns the uneven distribution of the alternative hypotheses, and makes more discoveries while controlling the false discovery proportion (FDP) at the desired level (0.1 in this case)

