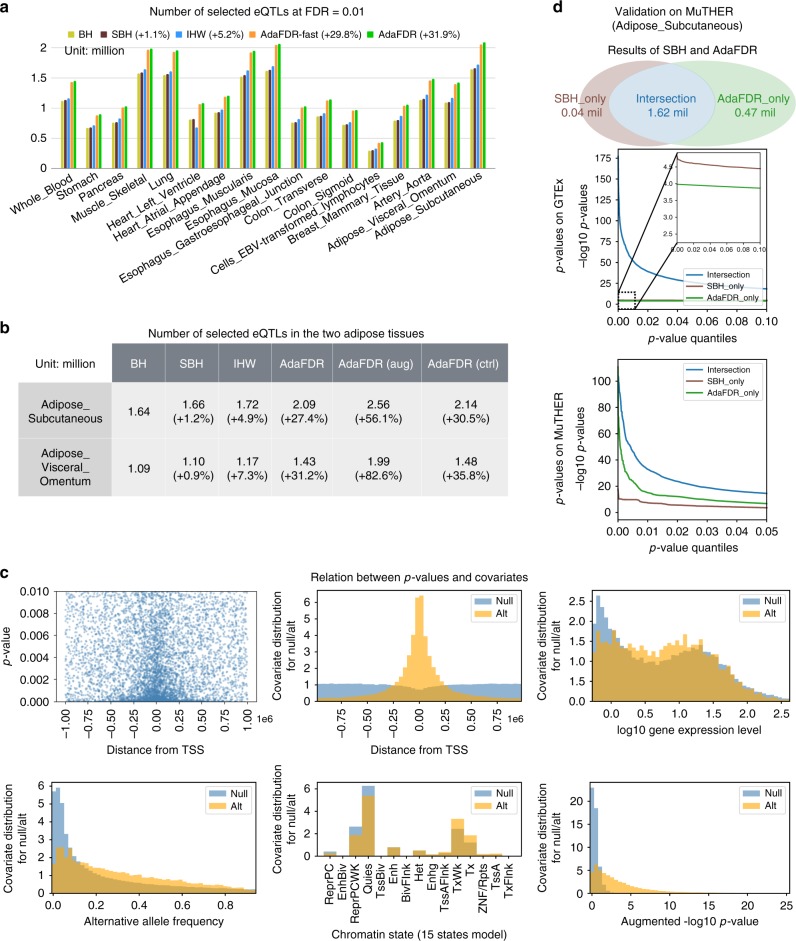
Fig. 2.
Analysis of the GTEx data. a Results of 17 tissues considered in the study. AdaFDR and its fast version AdaFDR-fast consistently make more discoveries than other methods. Source data are provided as a Source Data file. b Results on the two adipose tissues where the −log10 p-value from another tissue was added as an extra covariate. Using p-values from a similar tissue (AdaFDR (aug)) yields significantly more discoveries than using p-values from an unrelated tissue (AdaFDR (ctrl)). c Top-left: p-values (y-axis) plotted against the distances from TSS (x-axis); each dot corresponds to one SNP-gene pair. Small p-values at the center suggest that there is an enrichment of significant associations when the distance from TSS is small. Other panels: AdaFDR-estimated marginal covariate distribution for the null hypotheses (blue) and the alternative hypotheses (orange). Higher values of the orange distribution suggest an enrichment of alternative hypotheses. d Top: Discoveries made by SBH and AdaFDR. Middle: The p-values of these discoveries—SBH-only p-values are smaller than AdaFDR-only p-values on GTEx. Bottom: The p-values of the same set of discoveries on the independent MuTHER data, where AdaFDR-only p-values are smaller than SBH-only p-values, suggesting that AdaFDR-only discoveries are more likely to be true discoveries

