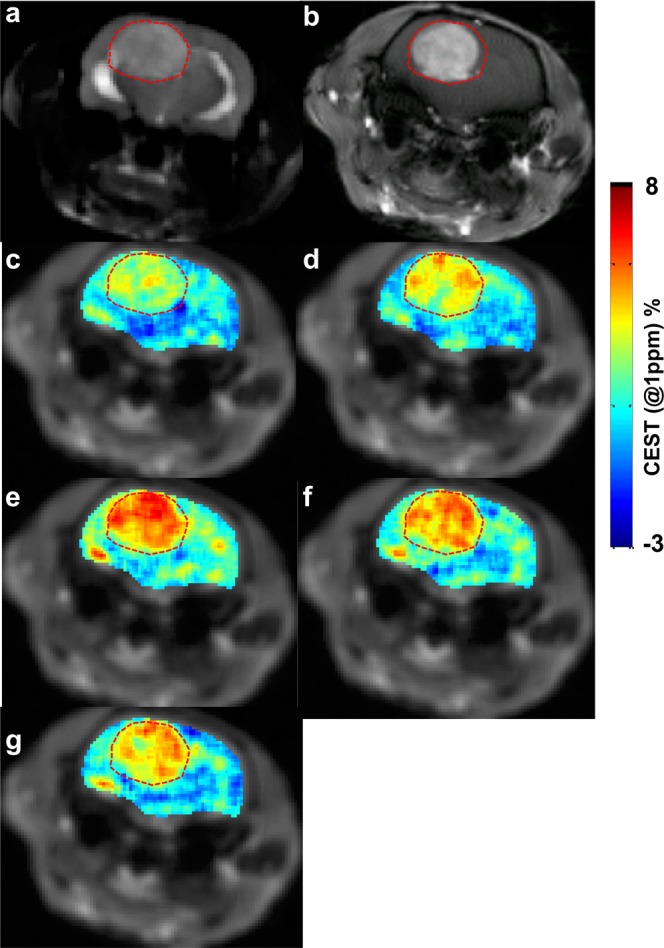
Figure 5.

The malCEST map of a rat brain tumor. (a) Anatomical T2-weighted image from axial slice showing the location of tumor as hyper intense region in the rat brain. (b) The T1-weighted image post Gd-DTPA administration highlights the tumor areas in the brain. (c–g) malCEST map from rat brain tumor shows increased contrast in tumor region following intravenous injection of maltitol peaking at 40 minutes following the start of injection (c, Pre-injection; d, 10 min; e, 40 min; f, 70 min; and g, 100 minutes post the beginning of maltitol administration).
