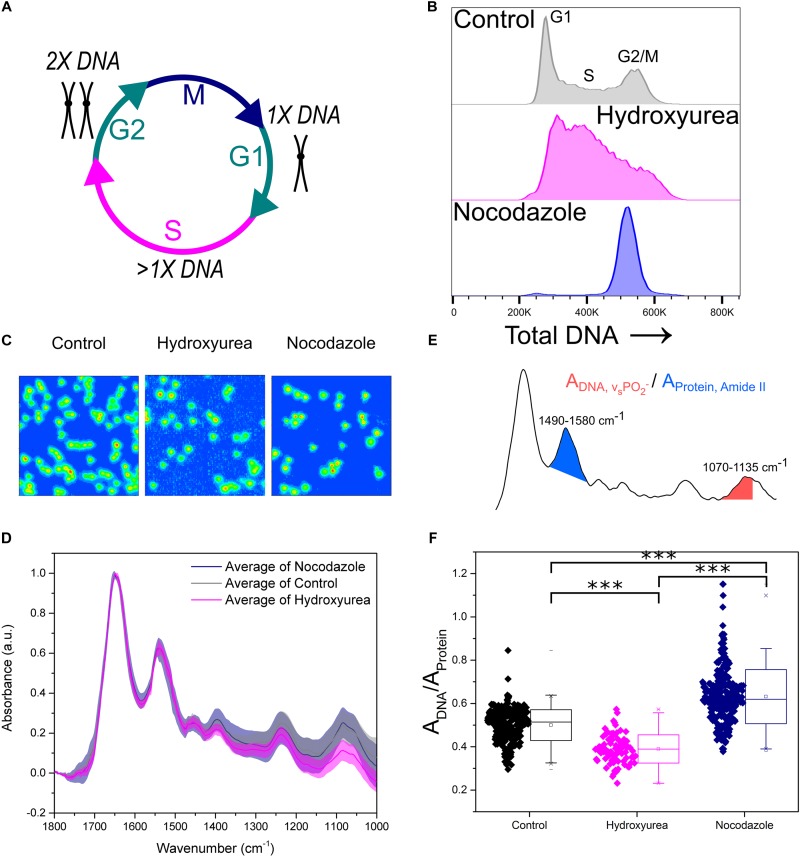
FIGURE 2.
Key FTIR spectral signatures associated with intracellular DNA levels identified. (A) Schematic of the cell cycle. Cells go from G1 phase with 1× DNA, through S phase where the DNA is replicated, to G2 phase with 2× DNA. Following this the cells enter M phase where they undergo mitosis and divide into two daughter cells. (B) Flow cytometry assessment of intracellular DNA content of cell samples: Control, Hydroxyurea treated and Nocodazole treated. DNA is stained by the fluorescent marker propidium iodide. (C) FTIR images of cell samples Control, Hydroxyurea treated and Nocodazole treated. (D) Average single cell spectrum for each cell treatment. Standard deviation is marked as a shaded area. (E) Representative spectrum indicating the peak ratios used for the single cell analysis in (F). (F) DNA-to-Protein peak ratio showing the spectral changes associated with differing levels of intracellular DNA at the single cell level. A t-test gave a statistically significant difference between samples (∗∗∗P ≤ 0.001).

