Fig. 1.
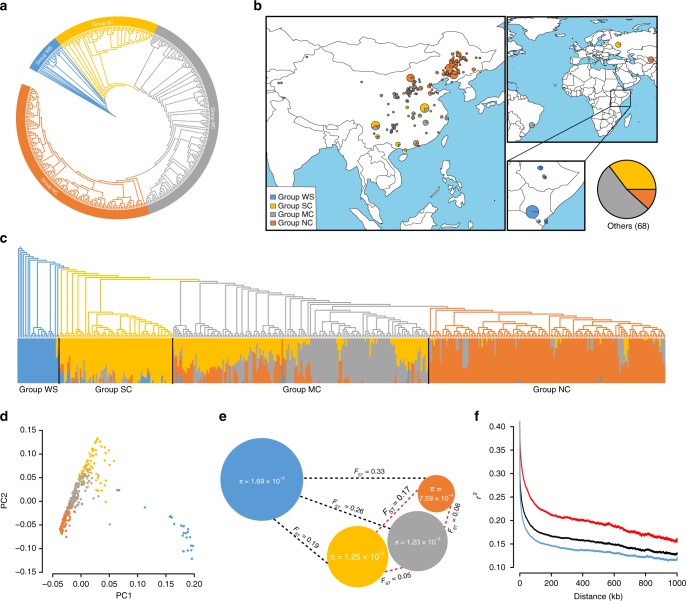
Population structure and geographic distribution of 405 castor accessions. a Phylogenetic tree of all accessions inferred from whole-genome single-nucleotide polymorphisms filtered by linkage disequilibrium (LD) r2 < 0.05; group names are given in the rings. b The geographic distribution of all accessions. The size of each pie chart represents the sample size in a specific location, with different scales shown in different frames for clarity. c The structure analysis (K = 4) matches the phylogenetic tree. The color in the structure plot indicates the component state in each sample. d Principal component analysis, showing the first two principal components; dot colors correspond to the phylogenetic tree grouping. e The diversity (π) and genetic distance (FST) across the groups, where color: phylogenetic group; radius of pie: genetic diversity; and dashed line length: FST value between two groups. f LD decay line chart. Blue: group WS; black: all accessions; red: all but group WS. Source data of c, d, and f are provided as a Source Data file

