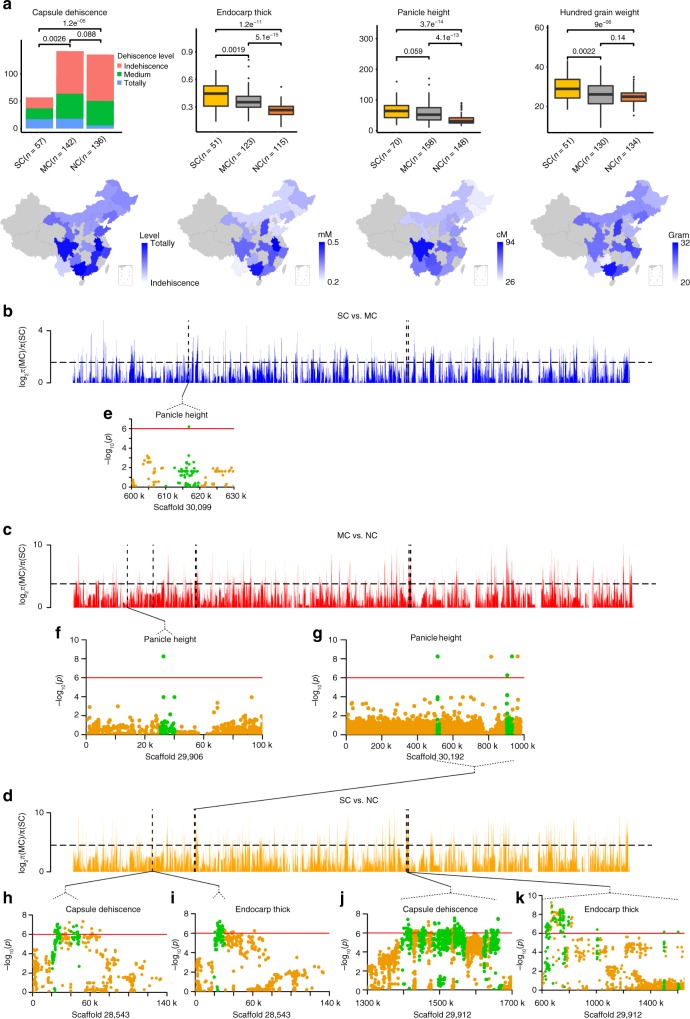
Fig. 2.
Geographical phenotype differentiation and genome regions under selection among groups. a Boxplot of phenotypes in group SC, MC, and NC coordinated with the heat map of phenotypes in each province in China. The center line reflects the median. The box limits are the upper and lower quartiles. Whiskers extend to data <1.5 times the interquartile range. The dots represent outliers. (P value shown, Wilcoxon test.) Each province in gray produced no samples or no more than three samples from the district. b–d π ratio bar plot with a top 5% dashed line for groups SC vs. MC, MC vs. NC, and SC vs. NC. e–k Single-nucleotide polymorphisms associated with capsule dehiscence, endocarp thickness, and panicle height by genome-wide association study merged with the selected region. Green dot: windows that underwent selection in the genome. Red cutoff line: −log10P = 6

