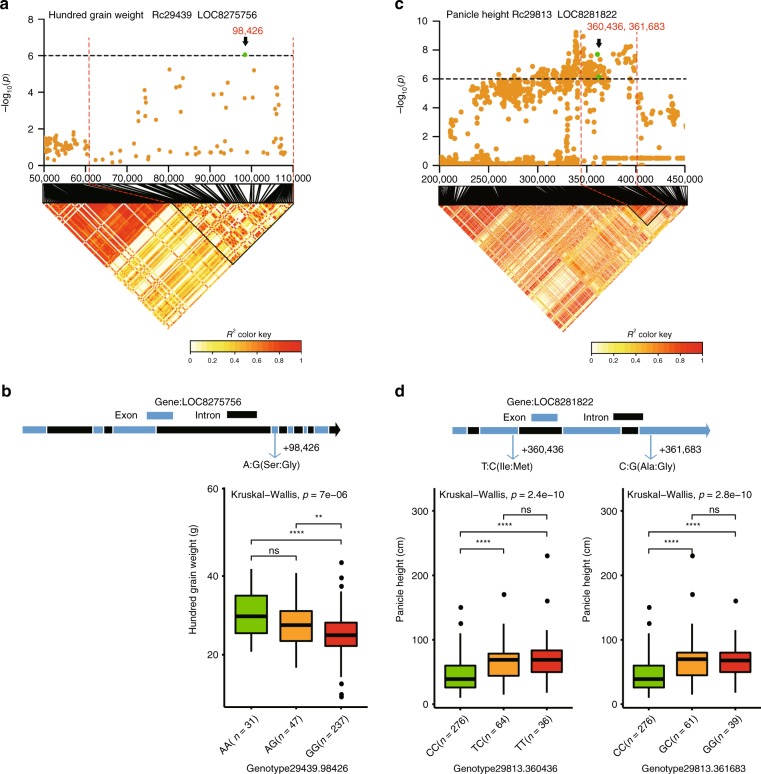
Fig. 4.
Identification of candidate genes for hundred-grain weight and panicle height based on genome-wide association study analysis. a Local Manhattan plot (upper) of panicle height and linkage disequilibrium (LD) heat map (lower). Green dots indicate the position of the nonsynonymous single-nucleotide polymorphisms (SNPs) located within LOC8275756, which was associated with hundred-grain weight. b The upper part shows the gene structure, and green and black rectangles indicate exons and introns, respectively; the lower box plots for the candidate gene LOC8275756 are based on genotype. c Local Manhattan plot (upper) of panicle height and LD heat map (lower). Green dots indicate the position of the nonsynonymous SNP located within LOC8281822, which was associated with panicle height. d The upper part shows the gene structure, and green and black rectangles indicate exons and introns, respectively. The lower box plots for candidate gene LOC8281822 are based on haplotypes. The center line indicates the median; the box limits are the upper and lower quartiles, respectively; the whiskers extend to data <1.5 times the interquartile range; and the dots are outliers (**P < 0.005, ****P < 0.00005, ns indicates no significance, Kruskal–Wallis test; n indicates the number of accessions with the same genotype)

