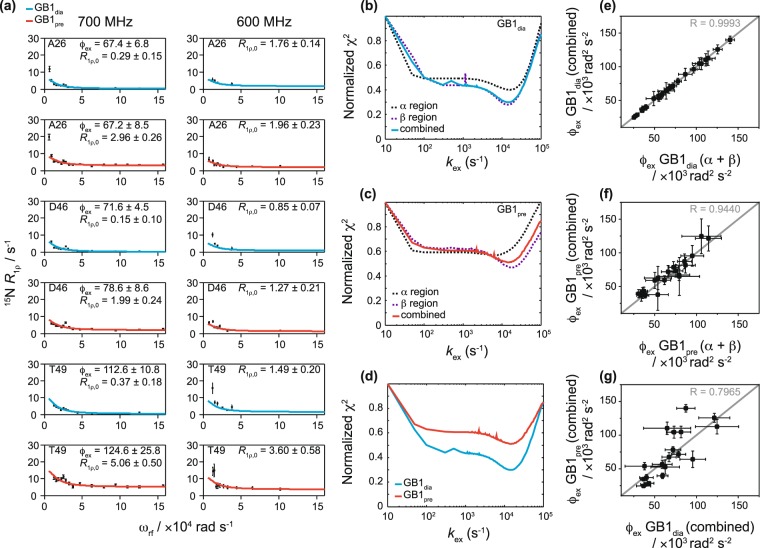
Figure 1.
15N R1ρ relaxation dispersion for crystalline GB1. (a) Example fits based on the data from the sample without paramagnetic dopant (GB1dia) (blue lines, kex = 14 ± 0.5 × 10³ s−1) and the sample with paramagnetic dopant (GB1pre) (red lines, kex = 15 ± 2 × 10³ s−1) obtained from measurements at 600 MHz (14.1 T) and 700 MHz (16.4 T) and a sample temperature of 300 ± 2 K. For simplicity the units for the residue specific φex and R1ρ,0 are omitted in the graphs and are ×103 rad2 s−2 and s−1, respectively. (b–d) Agreement between experimental and fitted data represented by plots between fixed exchange coefficients, kex, and the corresponding normalized χ2 values from joint fitting of relaxation dispersion curves for different groupings of residues in GB1dia (b) and GB1pre (c), as well as a comparison of normalised χ2 values from global fits in GB1dia and GB1pre (d). The fits obtained from the different groupings are indicated with dotted black lines for the α-helix region, dotted purple lines for the β–sheet region and solid lines for all residues together (blue for GB1dia and red for GB1pre). (e, f) Correlation plots for φex values based on fits of all residues together and the α-helix and β-sheet regions separately for GB1dia (e) and GB1pre (f). (g) Correlation plot for φex values based on fits of all residues together between GB1dia and GB1pre. The correlation coefficient (R) is indicated in grey in each correlation plot.

