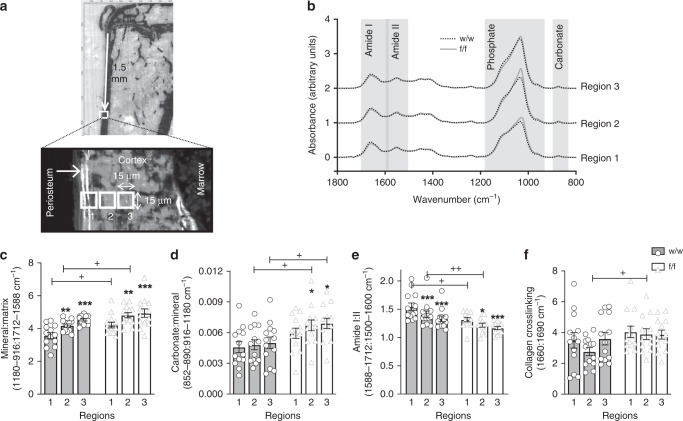
Fig. 3.
Elevated mineral accrual, carbonate deposition, and reduced amide I:II ratio in Dmp1Cre.Efnb2f/f cortical bone. a Regions of periosteal bone used for synchrotron-based Fourier-transform infrared microspectroscopy (sFTIRM) analysis. Note the double calcein label on the newly mineralized periosteum; regions 1–3 (15 μm2 in size) denote bone areas of increasing maturity with increasing distance from the periosteal edge. b Averaged sFTIRM spectra from regions 1, 2, and 3 of all 12-week old female Dmp1Cre (w/w) and Dmp1Cre.Efnb2f/f (f/f) tibiae; grey boxes show approximate regions of the amide I, amide II, phosphate, and carbonate peaks (see Method for details). c–f sFTIRM-derived mineral:matrix (c), carbonate:mineral (d), amide I:II (e), and collagen crosslinking (f) ratios in regions 1–3 of w/w and f/f tibiae. Data are represented as mean ± SEM, with individual values, n = 13/group. *p < 0.05, **p < 0.01, ***p < 0.001 vs. region 1 of same genotype (bone maturation effect), +p < 0.05, ++p < 0.01 vs. w/w in the same region (genotype effect) by two-way analysis of variance (ANOVA)

