Fig. 4.
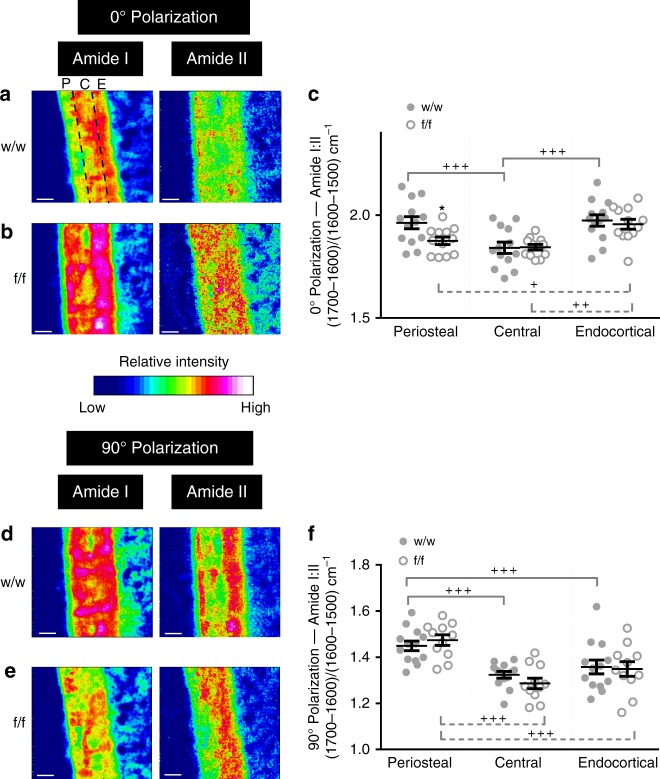
Polarized Fourier-transform infrared (FTIR) imaging confirms altered collagen distribution in Dmp1Cre.Efnb2f/f mice. Representative FTIR images showing relative intensity of amide I and amide II peaks in the cortical mid-shaft from 12-week old female Dmp1Cre (w/w) and Dmp1Cre.Efnb2f/f (f/f) mice under the (a, b) 0° and (d, e) 90° polarizing filters; quantification of the amide I:II ratio under the 0° (c) and 90° (f) polarizing filters in periosteal (P), central (C) and endocortical (E) regions (shown in the top left of panel a). Data are mean ± SEM, n = 12–13/group. *p < 0.05 vs. Dmp1Cre at the same region (genotype effect), +p < 0.05, ++p < 0.01, +++p < 0.001 vs region indicated by the bracket, within the same genotype (region effect) by two-way analysis of variance (ANOVA). Scale bar = 50 μm

