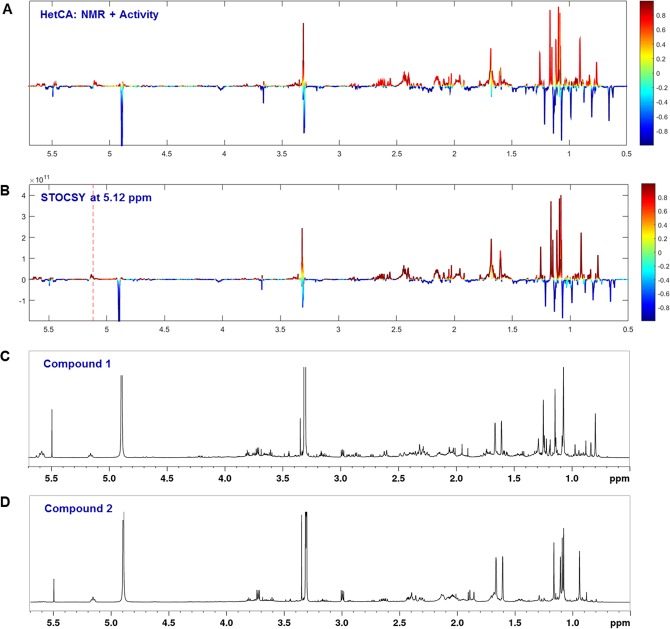
Figure 4.
Identification of LTT features which correlate positively or negatively with STS inhibition (see Fig. S3 for zoomed area). (A) NMR pseudo-spectrum showing the heterocovariance (HetCA) of 1H NMR spectra and STS inhibition data of selected fractions FP01_13 to _15. The colour code is based on the correlation coefficient: blue = negatively correlated with STS inhibition; red = positively correlated with STS inhibition. (B) Statistical total correlation spectroscopy (STOCSY) plot. The signal at δH 5.12 was chosen to obtain the information which molecule(s) share this “hot” feature. The plot is colour coded based on the correlation coefficient: blue = signals belonging to molecule(s) that do not have the signal at δH 5.12; red = signals belonging to molecule(s) that have the signal at δH 5.12. (C,D) 1H NMR spectra of isolated active compounds 1 and 2, respectively.

