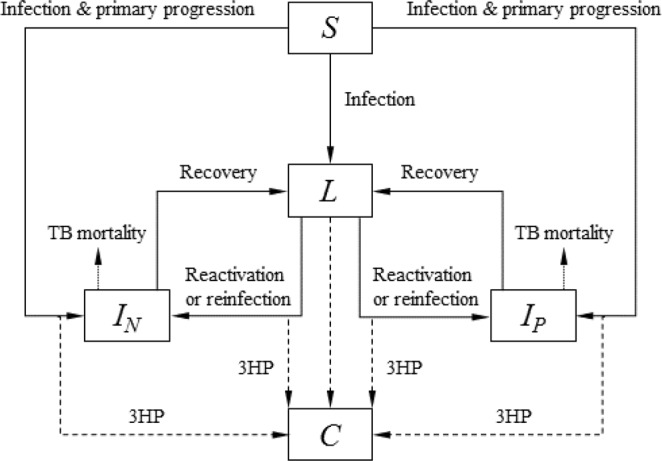
Figure 2.

Model structure. Core structure of the transmission model. S = susceptible, L = latently infected, IN = smear negative TB, IP = smear positive TB, C = post 3HP. Susceptible individuals are infected at a rate that depends on the prevalence of active disease. Following infection, some proportion progress directly to active disease (primary progression), the remainder entering the M.tb infected state. Infected individuals may remain infected, progress to disease (reactivation) or be re-infected, with some reduced risk of developing primary disease due to their prior infection. Individuals with active disease can die of TB, self-cure, or be diagnosed and treated for TB (recovery). Dashed arrows indicate the reduction in progression to TB (or treatment of M.tb infection) as a result of preventive therapy (3HP). For clarity the age structure, background mortality and HIV structure are not shown in the figure.
