Fig. 3.
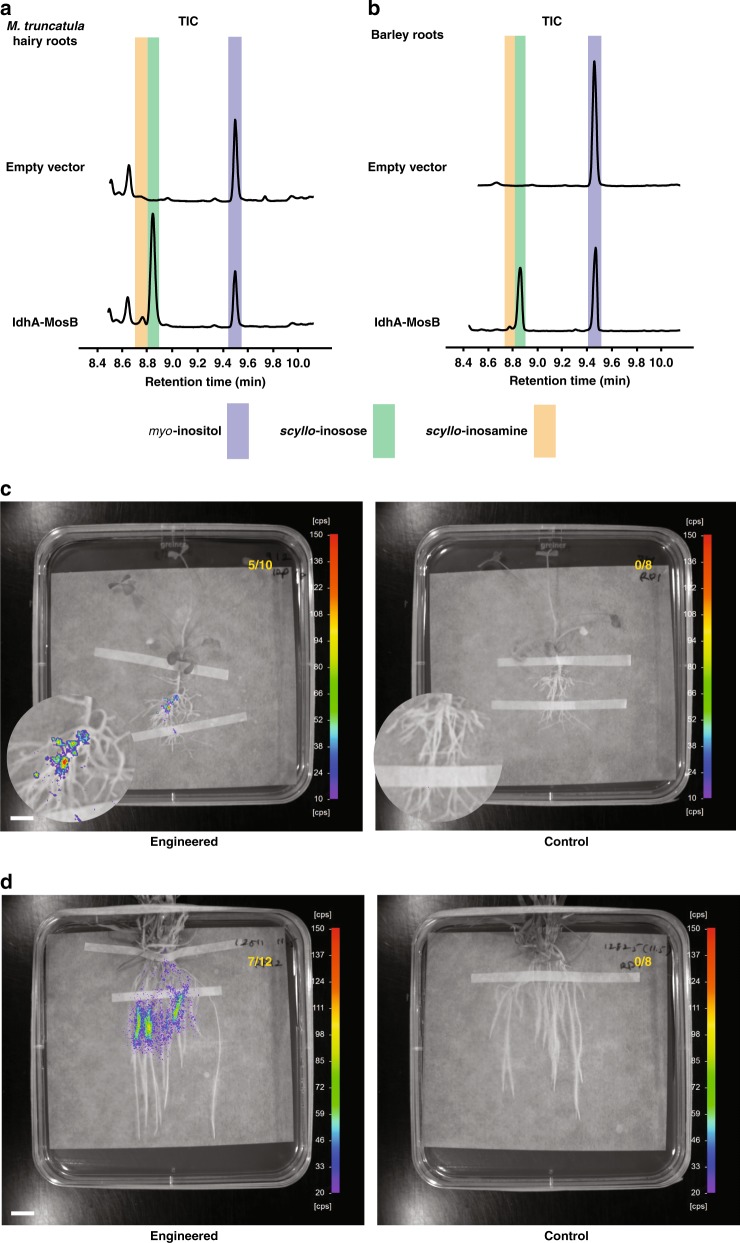
Rhizopine biosynthesis and signalling in M. truncatula and barley roots. a, b Gas chromatography-mass spectrometry (GC-MS) total ion chromatograms (TICs) of extracts prepared from M. truncatula transgenic roots (a) and transgenic T0 barley seedlings (b) transformed with empty vector (control) or IdhA-MosB together. Highlighted peaks indicate scyllo-inosamine 1 (orange), scyllo-inosose 7 (green) and myo-inositol 3 (dark blue). All chromatograms are representative of experiments repeated at least three independent times. Source data for GC-MS chromatograms are provided as a Source Data file in Supplementary Materials. c, d NightOwl images showing bioluminescence of Rlv3841/pOPS0046 rhizopine lux biosensor on the surface of M. truncatula transgenic roots (c) and T0 barley seedlings (d) transformed with empty vector (control) or IdhA-MosB together (engineered). Numbers in top right corners indicate number of plants tested that showed significant levels of bioluminescence (scale bar, 1 cm). Colours represent luminescence intensity from 10 or 20 counts per second (cool/purple) to 150 counts per second (warm/red). Source data underlying a, b are provided as a Source Data file

