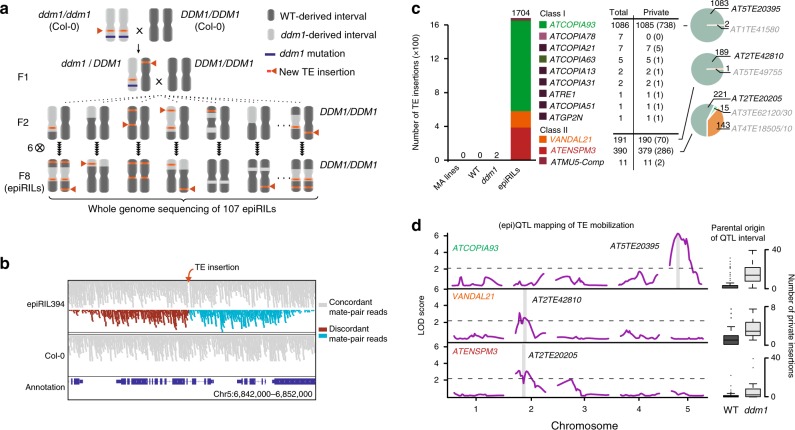
Fig. 1.
TE insertions accumulate in the epiRILs. a Crossing scheme used to generate the epiRIL population. b Sequencing alignment tracks for epiRIL 394 and Col-0. Concordant and discordant mate-pair reads, as well as the sense or antisense orientation for the latter, are indicated in gray, brown and cyan, respectively c Number and identity of insertions accumulated in wild-type, ddm1 and the epiRILs. Number of hemizygous insertions are indicated in brackets. Pie charts show the proportion of insertions matching different full-length reference TE sequences. d (epi)QTL mapping of the number of insertions produced by ATCOPIA93, VANDAL21, and ATENSPM3. The full-length reference TE sequence located within the single (epi)QTL interval in each case is indicated. Box-plots indicate the variation in the number of insertions in the epiRILs in relation to the parental origin of the relevant (epi)QTL interval. For each boxplot, the lower and upper bounds of the box indicate the first and third quartiles, respectively, and the center line indicates the median. Source data of Figs. 1b and 1c are provided as a Source Data file

