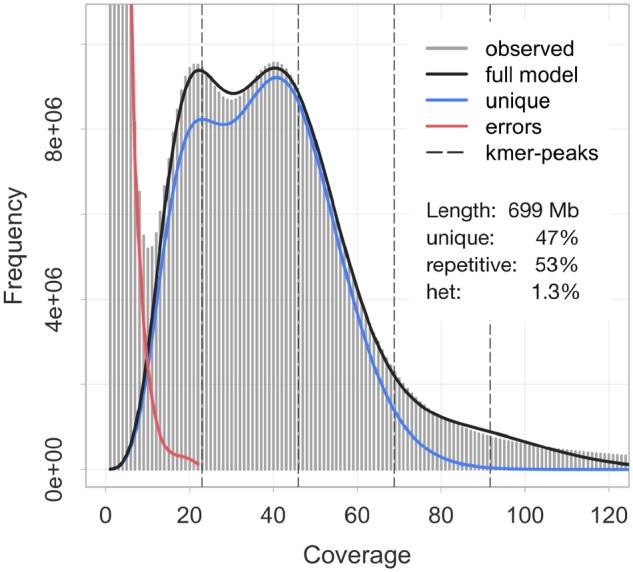
Fig. 2.

—k-mer profile (k = 21) of the Montipora capitata genome raw reads as calculated by Jellyfish and GenomeScope. Light gray bars show the observed distribution, whereas the dark gray, blue, and red lines indicate the modeled distributions of k-mers representing the full genome, the unique fraction of the genome, and sequencing errors, respectively. Estimated genome characteristics include the genome size (length), nonrepetitive portion of the genome (unique), repetitive portion of the genome (repetitive), and genome heterozygosity (het).
