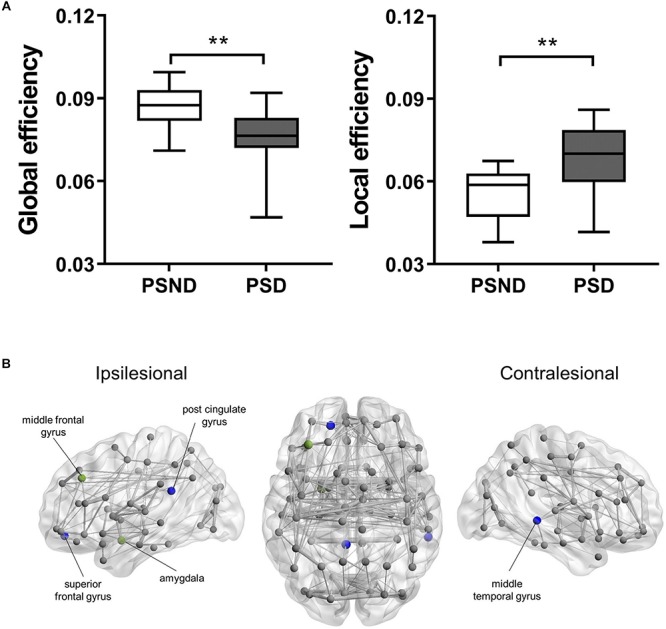
FIGURE 1.

(A) The boxplot (mean ± standard deviation) of global and local efficiency of PSD and PSND patients, ∗∗p < 0.01. (B) Illustration of the structural brain network of PSD patients showing brain regions with significant decreases in nodal degree (blue spheres) and nodal efficiency (green spheres) as compared to PSND patients. The width of network edge is weighted by the number of connections. PSD, post-stroke depression; PSND, post-stroke non-depression.
