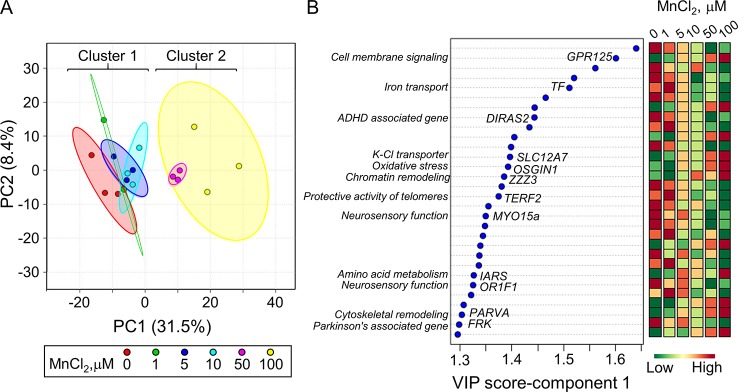
Figure 2.
Discriminatory genes contributing to Mn dose-dependent separation as determined by partial least-square discriminant analysis (PLS-DA). (A) PLS-DA score plot for transcriptomics data from Figure 1 , resulting in an Mn dose-dependent separation along principal component 1 (PC1-31.5%) is presented. (B) The top 30 discriminatory genes contributing the most to the separation by Mn dose is listed from top to bottom, ranked by their VIP scores (variable importance in projection scores, VIP ≥ 1.3). Changes in expression for each gene at each Mn dose are presented, wherein green: represents decrease and red: represents increase in transcript expression with increase in cellular Mn. The biological function associated with each gene is highlighted. Details on the top-ranked genes are provided in Table 1 .

