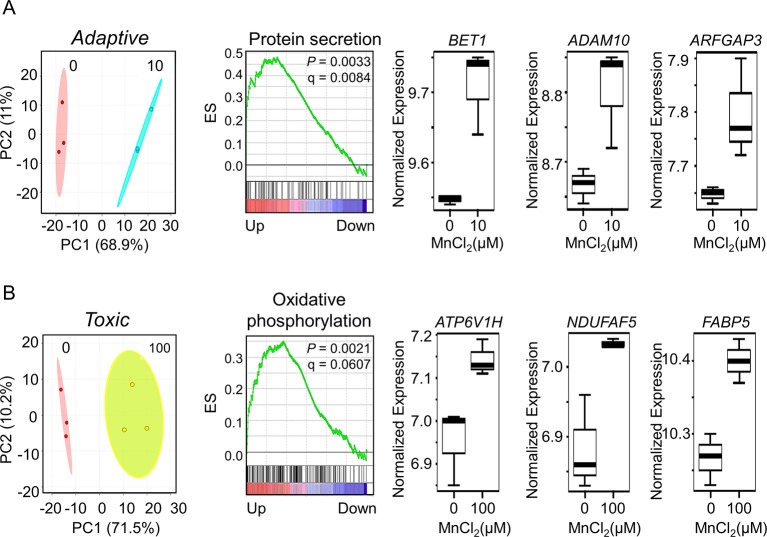
Figure 5.
Gene set enrichment and key discriminatory genes representative of adaptive versus toxicological Mn content. (A) PLS-DA score plot depicts separation between control and 10-μM Mn-treated groups along principal component 1, which accounts for a 68.9% of the variation in adaptive Mn concentration (left panel). Enrichment plot with enrichment score (ES), P-value, and q-value for FDR is shown for protein secretion pathway altered by adaptive Mn concentration (middle panel). Representative genes accounting for protein secretion pathway enrichment include BET1 (Golgi vesicular membrane-trafficking protein), ADAM10 (metallopeptidase domain 10), and ARFGAP3 (ADP ribosylation factor GTPase-activating protein 3) and are represented by box plots (right panel). (B) PLS-DA score plot shows separation between control and 100-μM Mn-treated groups along principal component 1, which accounts for a 71.5% of the variation in toxic Mn concentration (left panel). Enrichment plot is shown for oxidative phosphorylation pathway enriched by toxic Mn concentration (middle panel). Representative genes accounting for enrichment of oxidative phosphorylation pathway include ATP6V1H (ATPase H+ transporting V1 subunit H), NDUFAF5 (NADH: ubiquinone oxidoreductase complex assembly factor 5), and FABP5 (fatty acid–binding protein 5) and are shown as box plots (right panel). Details on the leading edge genes and their respective gene sets for adaptive and toxic Mn response are provided in Supplementary Table S3 and S4 , respectively. (P ≤ 0.05, n = 3 per Mn treatment group).

