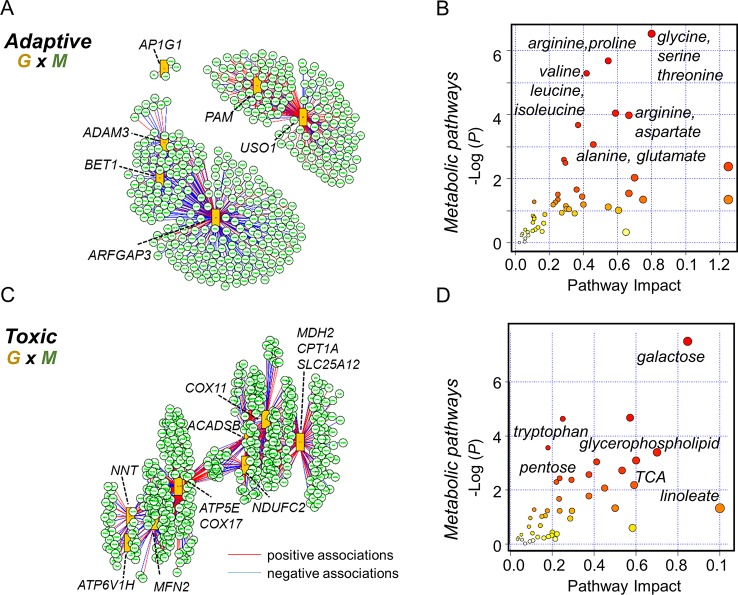
Figure 6.
Integrated transcriptome-metabolome wide association study (TMWAS) of Mn-dependent adaptive and toxic gene response pathways. (A) xMWAS integration analysis using metabolites and GSEA protein secretion gene set, as an adaptive response to 10 μM Mn, with 0.4 correlation threshold at P < 0.05 with sPLS canonical correlation method. (B) The protein secretion genes were associated with a number of amino acid metabolic pathways, determined by gene-metabolite joint analysis using MetaboAnalyst 4.0. Glycine, serine, and threonine metabolic pathway was the top most pathway associated with protein secretion gene set at 10 μM Mn. (C) Using similar parameters, metabolite network structure was obtained for GSEA oxidative phosphorylation gene set, as a toxic response to 100 μM Mn. In this, two of the genes (NDUFAF5, FABP5) shown in Figure 5B were not hubs but were correlated with hub genes, NDUFC2 (NADH:ubiquinone oxidoreductase subunit C2), and ACADSB (short-chain acyl-CoA dehydrogenase), CPT1A (carnitine palmitoyltransferase 1A), respectively. (D) The oxidative phosphorylation genes were associated with energy, lipid, and neurotransmitter pathways, determined by joint analysis. Galactose metabolic pathway was the top most pathway associated with oxidative phosphorylation gene set at 100 μM Mn followed by glycerophospholipid and tryptophan metabolism. Red lines represent positive correlation, and blue represents negative correlation between genes (G: orange rectangles) and metabolites (M: green circle). Metabolites associated with specific genes are provided in the text. Details on the leading edge genes and their respective gene sets for adaptive and toxic Mn response used in data integration are provided in Supplementary Tables S3 and S4 , respectively.

