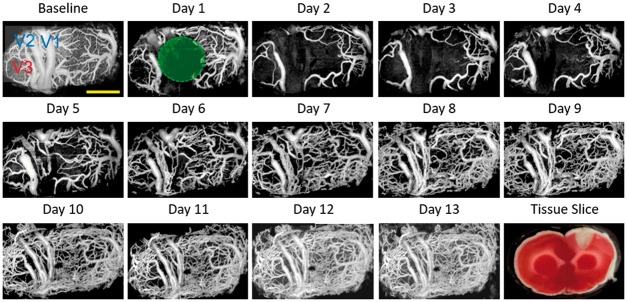
Figure 4.
Longitudinal monitoring of chronic post-PT vascular response in the male rat. Chronic monitoring was performed over 13 days. Baseline means the projection view before PT and day 1 means the day of PT administration. The green circle indicates the region of the 30-min laser irradiation. A representative tissue slice at day 1 was presented in the lower right corner. Scale bar = 1 mm.

