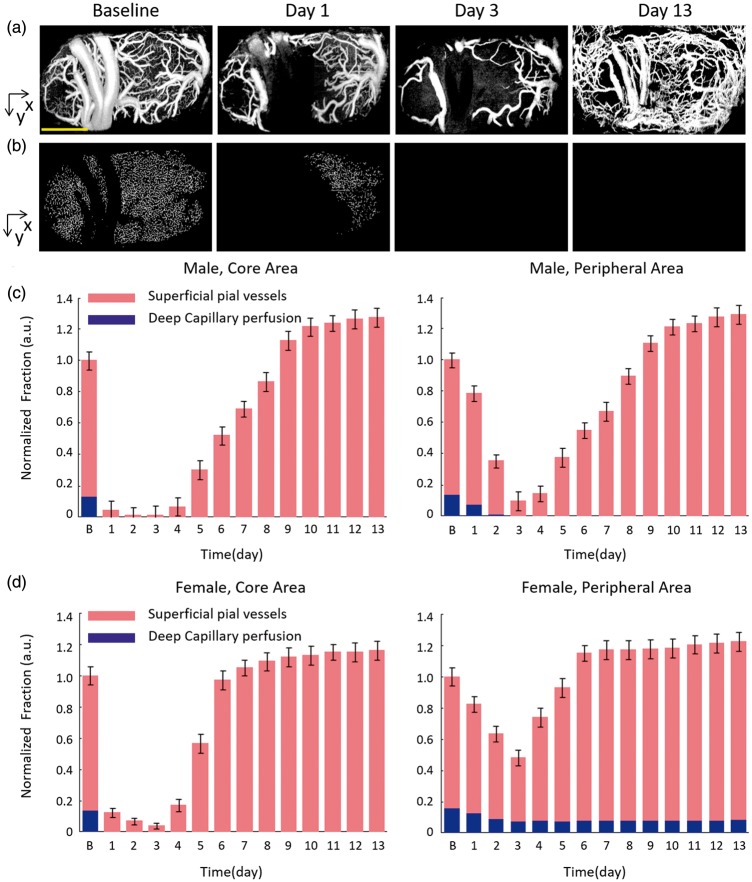
Figure 6.
Spontaneous responses of pial microvessels and capillaries network after PT occlusion. The original OCTA perfusion images were segmented into two layers: the superficial layer including pial microvessels ((a), from surface to depth 100 µm) and the deep layer including capillaries ((b), depth below 100 µm). Scale bar = 1 mm. Relative changes of vessel area density (VAD) of the superficial pial microvessels and the deep capillaries network in the irradiation core and the peripheral region of the male rats (c) and the female rats (d).

