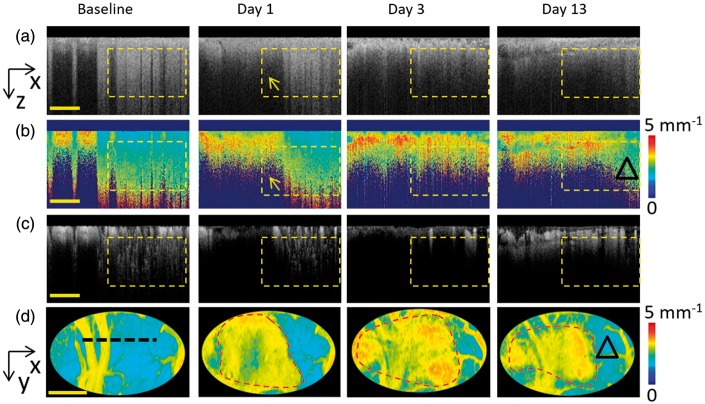
Figure 7.
Dynamic changes of cellular scattering. (a) From the left to the right, the original OCT structural cross sections of baseline, and at day 1, day 3 and day 13. (b) Scattering coefficient cross sections corresponding to the structural images in (a). (c) OCTA cross-sectional angiograms corresponding to the structural images in (a). Scale bar = 400 µm. (d) The projection pseudo-color images of 3D scattering coefficient corresponding to the region of Figure 4 of baseline, day 1, day 3 and day 13. The lesion boundary is marked with the red dot line after PT. Scale bar = 1 mm.

