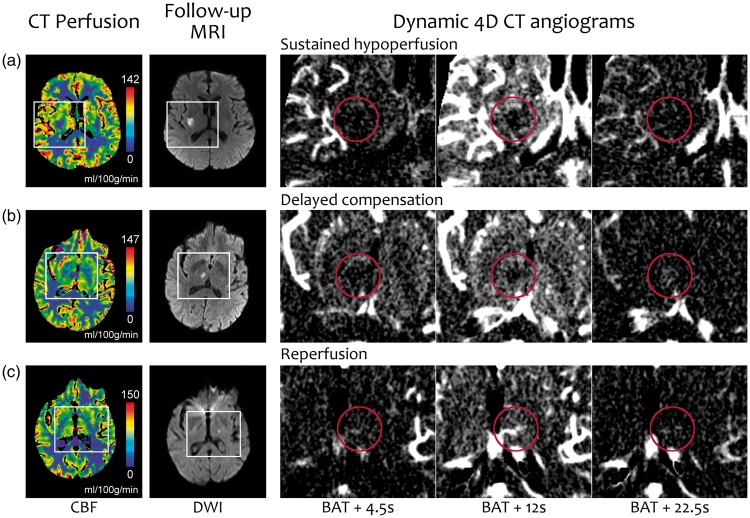
Figure 4.
Representative examples of each of the three commonest perfusion patterns on dynamic 4D CT angiograms (D4DCTA). The first and second columns show the CBF map and DWI, with white rectangles marking the areas enlarged in the next three columns that show frames of the D4DCTA with different times from the bolus arrival time (BAT). The red circle indicates the ROI of the ischemic lesion. (a) There is no contrast filling the ROI in any frame, which is consistent with a sustained hypoperfusion. The signal in the ROI in the third frame is not higher than in the surrounding parenchyma. (b)There is a late contrast filling visible in the third frame, indicating a delayed compensation. (c)An early antegrade contrast filling is visible in the first frame, consistent with reperfusion. For a better understanding of these patterns, see the Supplemental video online.

