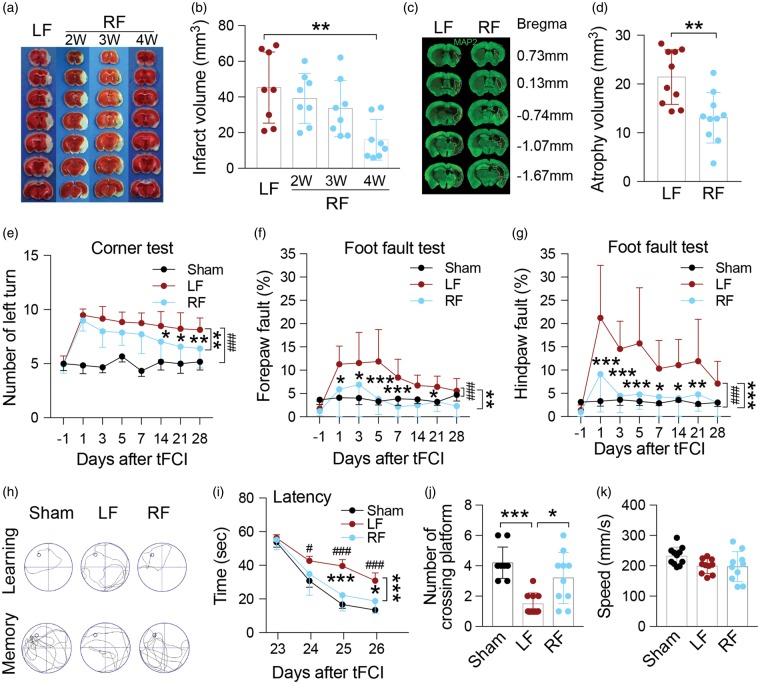
Figure 1.
Food restriction decreases infarct and atrophy volume, and alleviates neurological deficits induced by tFCI. (a) Representative brain images of TTC staining after tFCI of mice maintained on an ad libitum (LF) or restricted diet (RF). (b) Quantification of infarct volume indicating four weeks of RF was required for reduction of infarct volume after tFCI. n = 8 mice/group. **p ≤ 0.01 vs. LF. (c) Representative immunofluorescent images of brain slices stained for MAP2 28 days after tFCI. Dashed lines indicate area of brain atrophy. (d) Quantification of atrophy volume indicating that four weeks of RF-feeding reduces atrophy volume. n = 10 mice/group, **p ≤ 0.01 vs. LF. (e–g) Sensorimotor function and asymmetry as assessed by the corner test (e) and foot fault test (f, g) were improved after tFCI with RF-feeding for four weeks. n = 8 for sham, n = 12 mice/tFCI group. *p ≤ 0.05, **p ≤ 0.01 ***p ≤ 0.001 vs. LF, ###p ≤ 0.001 vs. sham. (h) Representative swim path from each treatment group during the spatial learning (top panel) and memory phase (bottom panel) of the Morris water maze test. (i) Latency in seconds (s) to find the submerged platform assessed during days 23–26 after tFCI shows that learning was improved in mice fed the RF diet. (j) Quantification on day 27 of the number of crossings over the region where the platform used to be indicates that memory was improved in RF-fed mice following tFCI. (k) Swimming speed during the probe test indicating no differences in gross motor function among groups. For i–k: n = 11 mice/sham group, n = 10 mice/ LF group, n = 10 mice/RF group. *p ≤ 0.05, ***p ≤ 0.001 vs. LF group, #p ≤ 0.05, ###p ≤ 0.001 vs. sham. All data are presented as mean ± SD.

