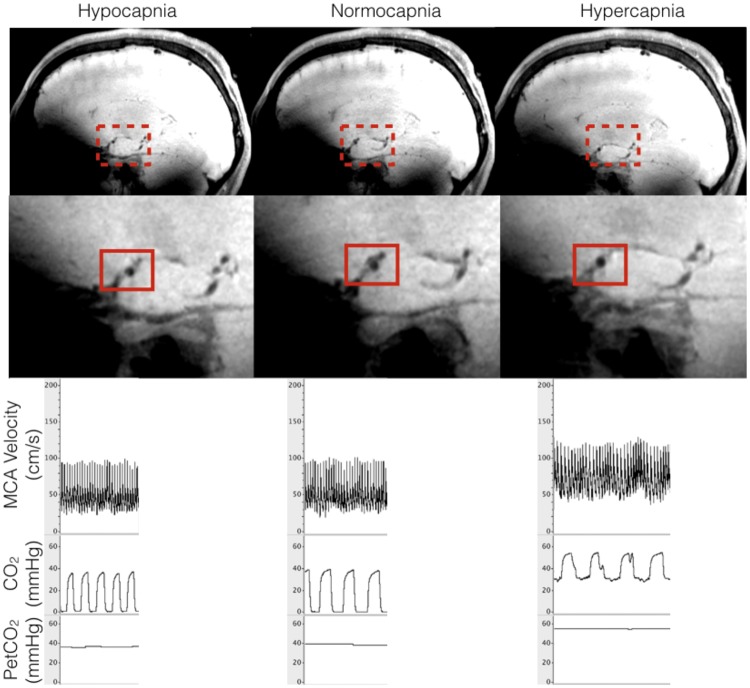
Figure 3.
Schematic of measurements taken from the laboratory and MRI sessions. Representative MRI image highlighting a transverse cross-section in the sagittal plane of the right middle cerebral artery during hypocapnia, normocapnia and hypercapnia breathing conditions, and the corresponding condition’s PetCO2 levels and right MCA velocity measures during the laboratory session.

