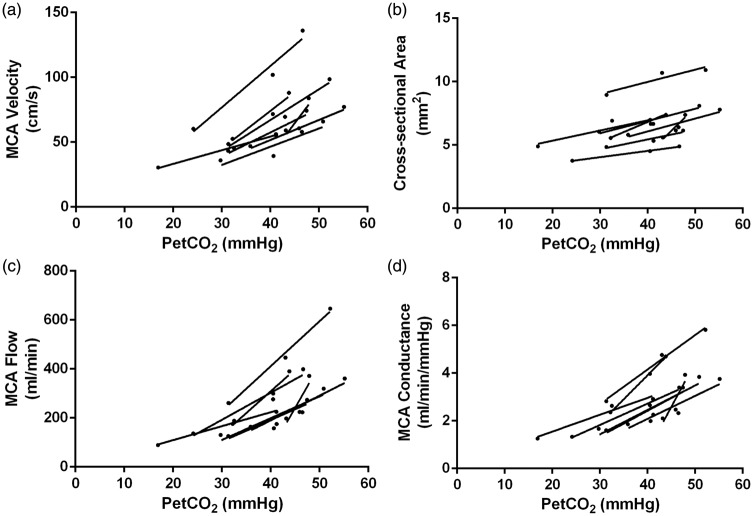
Figure 4.
Right middle cerebral artery (MCA) velocity, cross-sectional area (CSA), calculated flow, and conductance during hypocapnia, normocapnia and hypercapnia for each participant. Each participant’s data set is indicated by an individual line (n = 8). Panel A: MCA velocity increased from the hypocapnic to the hypercapnic states, as highlighted by positive slopes with increasing PetCO2 levels. Panel B: MCA CSAs increased from the hypocapnic to the hypercapnic states, as highlighted by positive slopes with increasing PetCO2 levels. Panel C: MCA flow (ml/min) increased from the hypocapnic to the hypercapnic states, as highlighted by positive slopes with increasing PetCO2 levels. Panel D: MCA conductance increased from the hypocapnic to the hypercapnic states, as highlighted by positive slopes with increasing PetCO2 levels.

