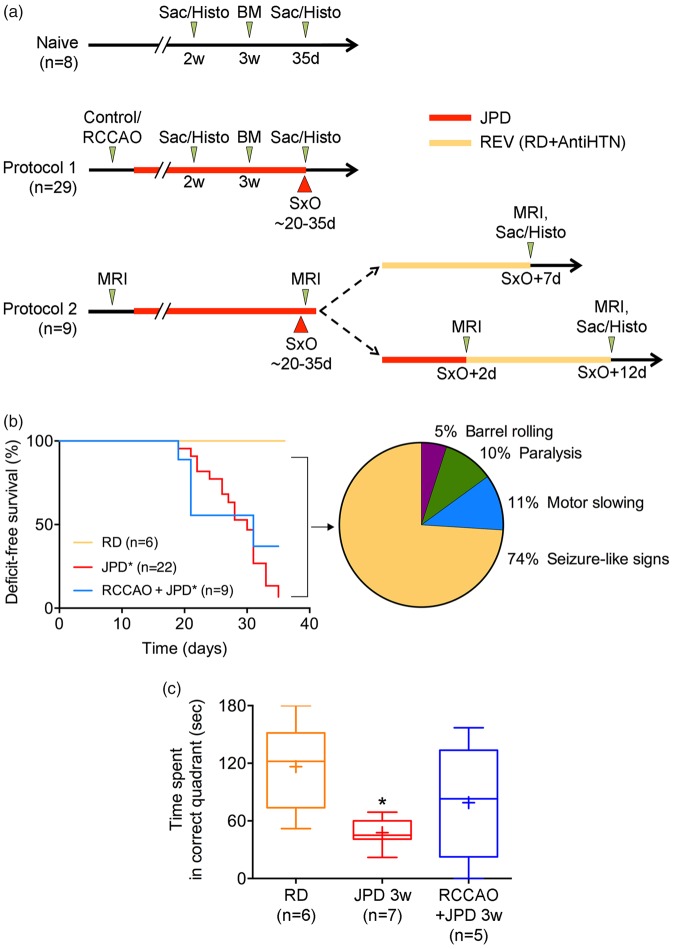
Figure 1.
Experimental timelines, deficit-free survival, and neurological signs. (a) Naïve SHRSPs were maintained on regular diet (n = 8). A subset was sacrificed at two weeks to examine early histopathological changes (n = 2). Remaining animals were examined using Barnes maze (BM) at three weeks, followed for a total of 35 days for neurological signs, and then sacrificed for histopathological examination. In protocol 1, 29 SHRSPs were assigned to control (n = 20) or right common carotid artery occlusion (RCCAO, n = 9) groups, and then started on high-salt Japanese permissive diet (JPD). A subset of the control group was sacrificed at two weeks to examine early histopathological changes (n = 7). Remaining animals were examined using BM at three weeks, and followed until the onset of neurological signs (SxO). At SxO, all animals were sacrificed for histopathological studies. Protocol 2 was designed to test reversibility followed by MRI (n = 9). Animals in protocol 2 had a baseline MRI and started on JPD. A second MRI was performed at SxO. One animal was excluded due to a developmental cyst. In the immediate reversal experiment, MRI was repeated seven days after SxO, and animals were sacrificed for histopathology (n = 4). In the delayed reversal experiment, MRI was repeated 2 days after SxO while still on JPD and 10 days after reversal, after which animals were sacrificed for histopathology (n = 4). (b) Neurological signs started during the third week on high-salt Japanese permissive diet (JPD) and progressed throughout the five-week follow-up in SHRSP. Right common carotid artery ligation (RCCAO) on JPD did not significantly differ from JPD alone. Amongst the 37 animals (representing 100% of the pie chart), most common initial neurological sign was seizure-like activity, whereas motor slowing and paralysis, and frank barrel rolling seizures were less common. *p < 0.05 vs. RD, log-rank (Mantel–Cox) test. The initial sample sizes are shown on the figure; numbers of animals at risk at 10, 20 and 30 days were 22, 22 and 19 for JPD, and 9, 9 and 6 for RCCAO + JPD groups, respectively. The pie chart shows the % of all animals that displayed a specific sign. (c) Barnes maze test performed before the emergence of neurological signs showed spatial learning deficits in SHRSP on JPD. *p < 0.05 vs. RD; one-way ANOVA followed by Sidak's multiple comparisons test (whiskers, full range; boxes, interquartile range; horizontal line, median; + , mean).

