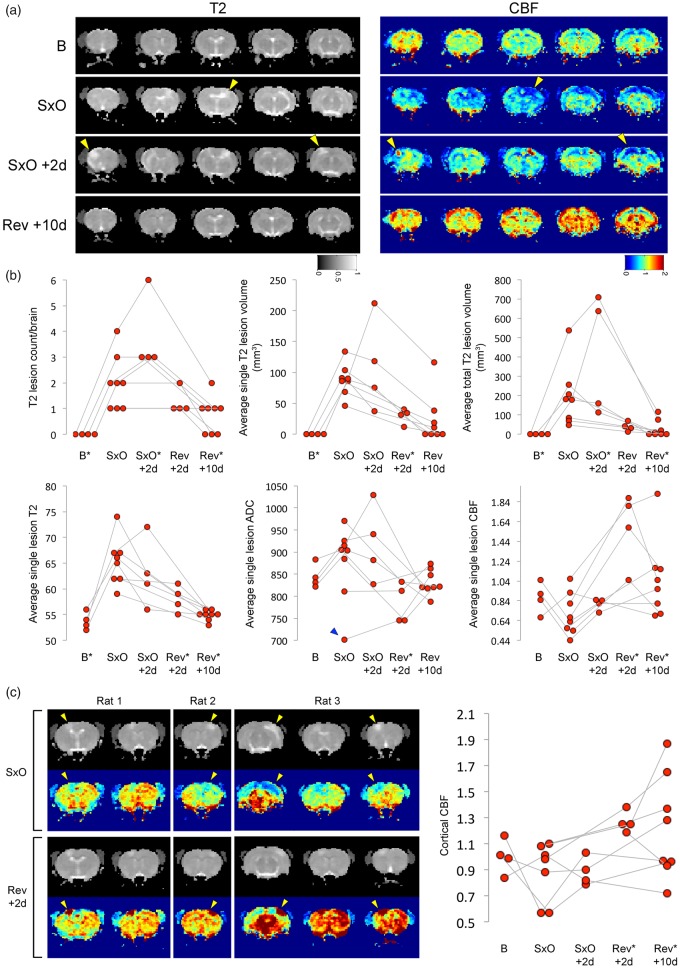
Figure 2.
MRI lesions. (a) Longitudinal MRI showing T2 and cerebral blood flow (CBF, arterial spin labeling) changes at baseline (B), onset of neurological signs (SxO), 2 days after SxO (SxO + 2 days), and 10 days after switching to regular diet and starting antihypertensive treatment (Rev + 10 days) in a representative SHRSP on high-salt Japanese permissive diet. Arrowheads point to the arterial border zone regions that showed a propensity to develop T2 and ADC hyperintensities and mild hypoperfusion. Switching to regular diet and starting antihypertensive treatment reversed T2 and ADC changes and led to relative hyperemia. (b) The time course of lesion morphometry and signal intensity showed a progressive increase in the number and size of T2 lesions in each animal while on high-salt diet (first row). Average T2 and ADC signal intensity within the lesions increased while on high-salt diet, whereas CBF tended to mildly decrease (second row). Switching to regular diet and starting antihypertensive treatment rapidly reversed T2 and ADC changes, and led to significant hyperemia. *p < 0.05 vs. SxO; longitudinal, random intercept, linear mixed effects model, followed by pair-wise multiple comparisons between SxO and each other time point. Connected data points represent a single animal. (c) Images from three representative rats show hypoperfusion within the lesion at SxO, turning into severe hyperemia at Rev + 2 days (arrowheads). Although most severe within the lesion, hyperemia after Rev usually involved the entire brain. Graph on the right shows the time course of CBF changes averaged across the entire cortex. *p < 0.05 vs. SxO; longitudinal, random intercept, linear mixed effects model, followed by pair-wise multiple comparisons between SxO and each other time point. Connected data points represent a single animal.

