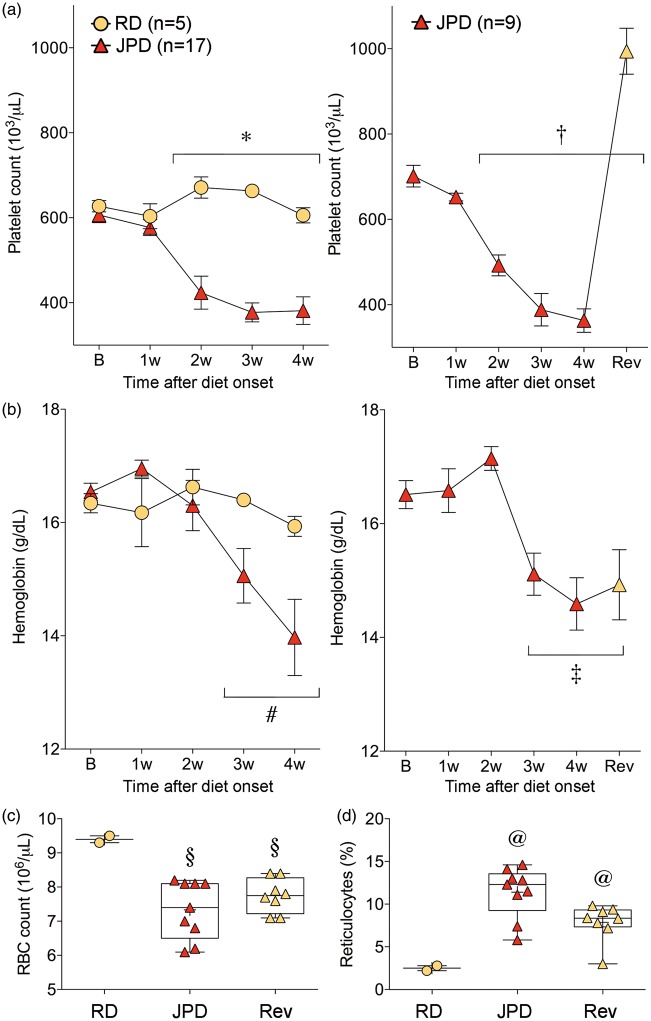
Figure 6.
Hematological changes. Platelet counts (a), hemoglobin concentration (b), red blood cell (RBC) count (c), reticulocyte percentage at sacrifice time point (d), all suggest a thrombotic microangiopathic process in SHRSP on high-salt diet (JPD). Platelet counts, but not anemia or reticulocyte counts, were rapidly normalized upon resuming regular diet (RD) and starting antihypertensive treatment (Rev). *p < 0.05 JPD vs. RD, and JPD two to four week vs. JPD baseline; †p < 0.05 JPD two to four week and Rev vs. JPD baseline; #p < 0.05 JPD two to four week vs. JPD baseline; ‡p < 0.05 JPD three to four week and Rev vs. JPD baseline; two-way ANOVA followed by Sidak’s and Dunnett's multiple comparisons tests. §p < 0.05 vs. RD; @p < 0.05 vs. all other groups; one-way ANOVA followed by Holm–Sidak's multiple comparisons test. Each data point in C and D represents a single animal.

