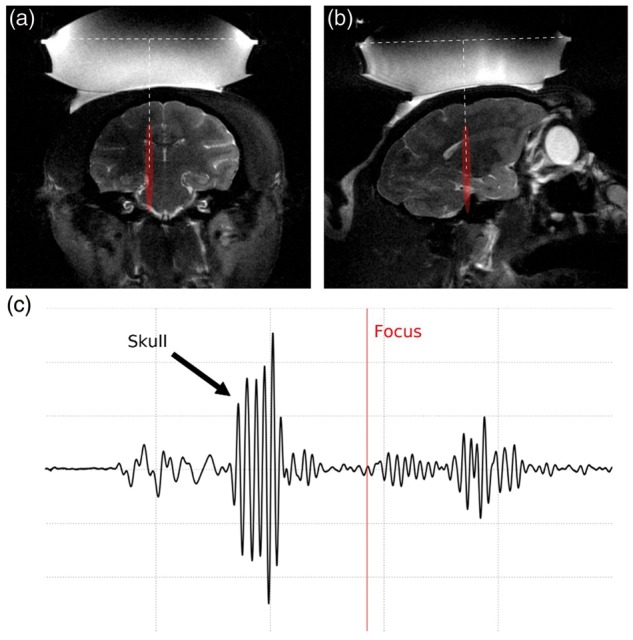
Figure 1.

Target planning and verification of acoustic coupling. (a) Coronal and (b) sagittal slices at the expected focus region (in red) using T2-weighted MR images (water balloon and coupling gel shown in hyper intense areas). (c) Pulse-echo ultrasound signal showing the skull reflection and estimated focus depth (red line) based on the ultrasound time-of-flight.
