Figure 2.
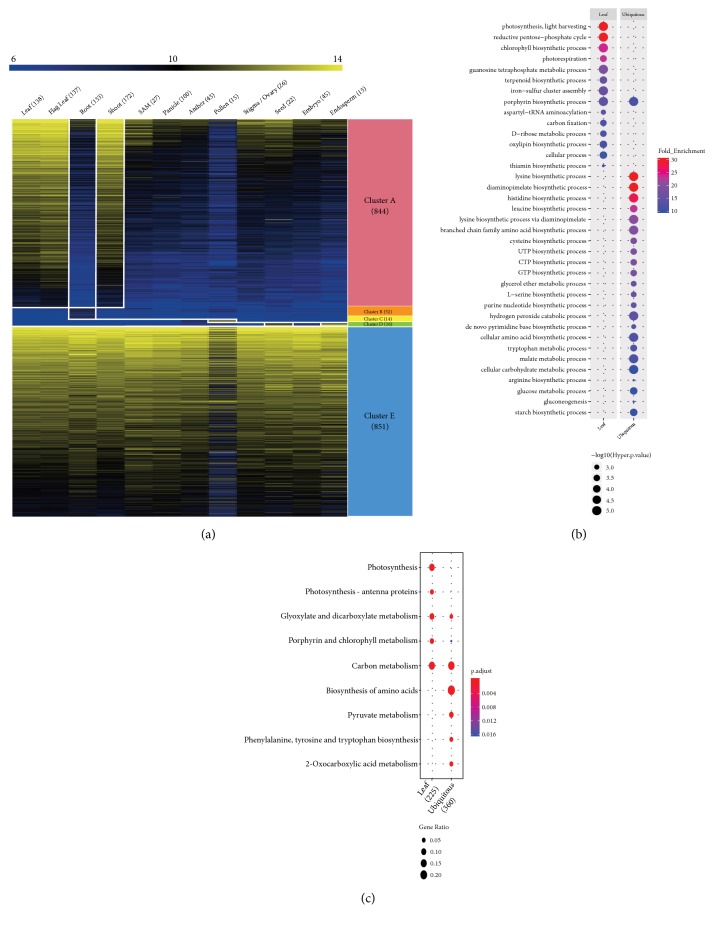
Meta-expression profile and functional analysis of the 1,695 leaf-preferred or ubiquitously expressed genes. We performed meta-expression analysis with large-scale microarray dataset for elucidating tissue-specific patterned plastid genes. In addition, we performed GO and KEGG enrichment analysis to identify functional roles for two clusters, leaf-preferred cluster A and ubiquitous cluster E. (a) Heatmap analysis of plastid-related genes and identification of five clusters. We performed KMC clustering into 20 clusters using Euclidean distance matric and selected 10 clusters on the basis of tissue-specific expression patterns. Among these clusters, we selected two major clusters, A (leaf-preferred genes) and E (ubiquitous genes) for further functional enrichment analysis. Digits under or beside each clusters indicate number of the genes that were classified into each cluster. (b) GO enrichment analysis of 1,695 leaf-preferred and ubiquitous expressed genes. To reveal characteristics of each cluster, we conducted GO enrichment analysis and visualized the result with ggplot2 package. GO terms were classified according to biological process GO terms. Dot color indicates fold-enrichment value (blue color is 2-fold, which is the minimum cut-off to select significant fold-enrichment value, and red color indicates higher fold-enrichment value greater than two), and dot size indicates statistical significance (-log10(hyper p-values) are used, with higher values having greater significance). (c) KEGG enrichment analysis of two clusters, A and E. Enriched KEGG pathway indicated with dot size representing the ratio of selected genes to total genes in the pathway and dot color illustrating adjusted p-value. The numbers below clusters indicate the number of mapped genes to selected KEGG pathways.

