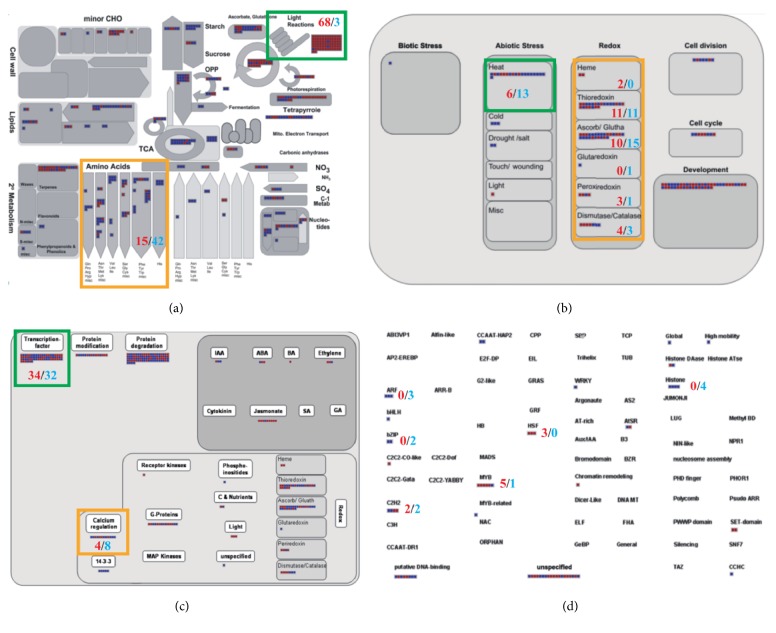
Figure 3.
Functional classification of the leaf-preferred or ubiquitously expressed plastid genes via MapMan analysis. MapMan analysis of the two clusters for functional classification within various biological processes. (a) Metabolism overview, (b) cellular response overview, (c) regulation overview, and (d) transcription factor overview. Red and blue squares indicate members of leaf-preferred and ubiquitously expressed clusters, respectively. In addition to squares, red and blue digits show number of squares. Green box and orange box in metabolism, cellular response, and regulation overview highlight areas that are discussed in the Results.

